


In this session, Kyle Myers talks about where science funding actually goes (what influences how much money goes to cancer research? How can we see funding shifts in scientific publication data?) and the mechanisms the US government uses to spend it.
Imagine you want to encourage more or better innovation. You want to create a new cure or understand an important social phenomenon. How do you make that happen? Funders have numerous approaches that they can use.
In July, IFP (with Kyle’s help) released the Atlas of Innovation, a website that helps policymakers and philanthropists navigate decisions about how to fund innovation.1 This lecture provides an in-depth complement to the site: Kyle delves into the different economic structures that underpin grants, contracts, prizes, and other funding approaches.
In the image below, from Azoulay & Li’s paper Scientific Grant Funding — which Kyle discusses — the authors provide intuition on when we should think about using different types of innovation funding mechanisms. It’s worth digging into this chart on grants, prizes, patents, and contracts.
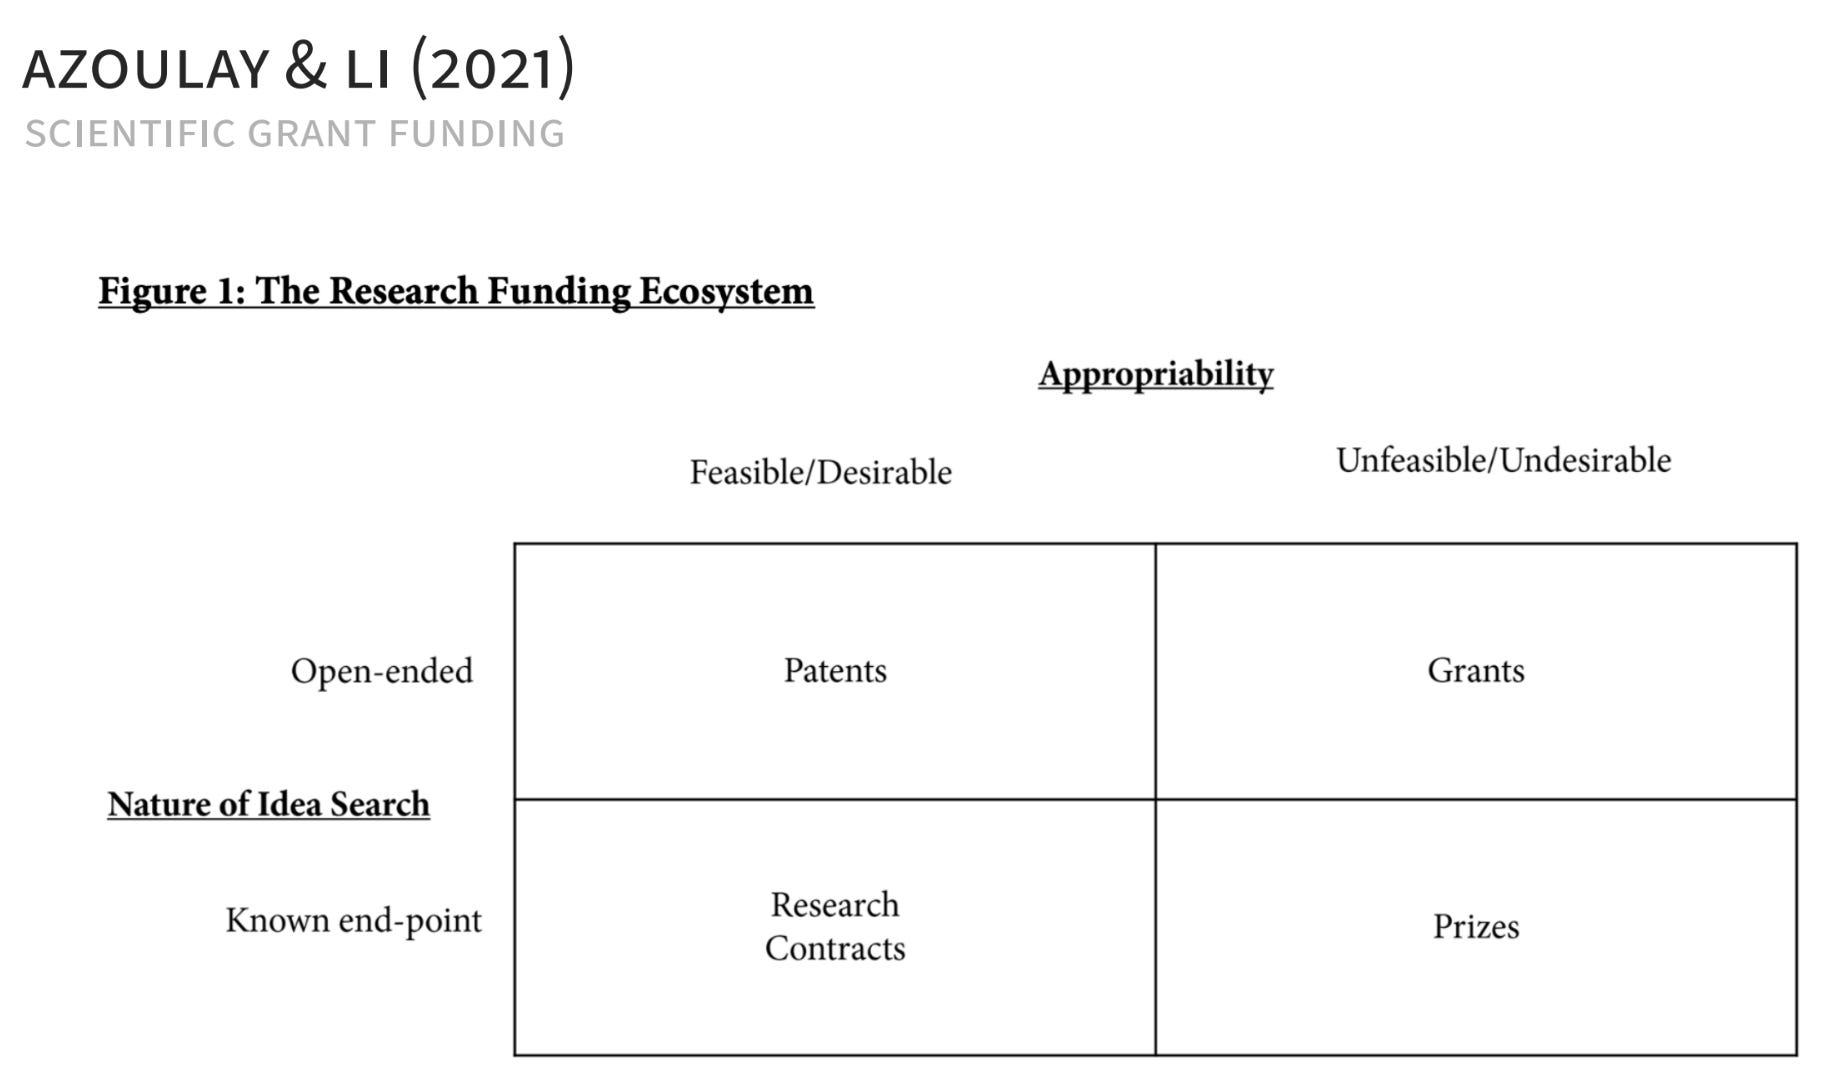
Grants: As described in the Atlas of Innovation, grants support “researcher-led work within a defined scope.” They are funds generally provided to researchers with limited strings attached and an expectation that the research will produce public benefits. According to Azoulay and Li, grants are useful when the innovator shouldn’t or can’t capture the value created through their research and the output desired is open ended.
Prizes: A prize is “a competition that rewards teams for meeting a defined innovation target.” Funding could be provided for reaching a target like solving a mathematics problem or creating an important new technology. Like grants, they are most appropriate when the innovator shouldn’t or can’t capture the value created and where there is a public benefit.
Patents: Patents provide “firms a period of market exclusivity;” they incentivize innovation by protecting innovators when they produce profitable ideas. In this case the government is not providing innovators money, but rather is protecting them from competition. Patents are best when the government doesn’t have a desired end-point (e.g., they don’t specify priority technologies to be patented) and the innovator can and should capture the value created.
Contracts: “A contract is an agreement in which a funder contracts with a specific performer, often a company, to conduct R&D.” Contracts are like prizes in that there is a known end-point — in this case the thing the performer is being contracted to do — but the outputs of the research will be captured by the funder or innovator.
How science is funded is a critical area of study if you’re interested in making government-funded research more effective. Often, federal agency staff are unaware of the tools they have at their disposal, as well as when they might be more or less appropriate to use. This gives them — and you! — the information needed to effectively fund research and innovation.
Here are the readings that go with this lecture:
Carnehl, Christoph, Marco Ottaviani, and Justus Preusser. “Designing Scientific Grants.” Entrepreneurship and Innovation Policy and the Economy 4.1 (2025): 139-178.
Hegde, Deepak, and Bhaven Sampat. “Can private money buy public science? Disease group lobbying and federal funding for biomedical research.” Management Science 61.10 (2015): 2281-2298.
Myers, Kyle. “The elasticity of science.” American Economic Journal: Applied Economics 12.4 (2020): 103-134.
Acemoglu, Daron. “Diversity and technological progress.” The Rate and Direction of Inventive Activity Revisited. University of Chicago Press, 2011. 319-356
Carnehl, Christoph, and Johannes Schneider. “A quest for knowledge.” Econometrica 93.2 (2025): 623-659.
Thanks to William Higbie and Harry Fletcher-Wood for their support in producing this video and the transcript.
Lecture Transcript:
The Direction of Science
My name is Kyle. I am an associate professor at the Harvard Business School, and today we’re going to be talking about the direction of science. Some fun stuff. I like to show graphs with things not labeled and have people guess what’s going on.
We’re going to be talking about the direction of science, and I want to be clear about what direction means. You will already have heard from Ben and Chad Jones, the wonderful Joneses. Soon Matt Clancy will talk with you. A general message of a lot of that work is that on average, when we put money into this thing called R&D, or science, or innovation, a lot of great stuff happens. Today is going to be a lot about — conditional on putting a dollar into this magical growth engine, there are lots of specific things to invest in. Where that money goes is what I mean when I say “the direction of science.” We’re usually interested not in the level of investment across all areas but the ratio of investments in different areas.
Reading the direction of science through publication data
To give you a sense of what variation in the direction of science can look like through one lens, I’ve got a few graphs here of publication shares. Publication metrics over time are always hard to interpret. You should take any trend line you see with publication data with a large dose of medicine. But I’ve got a few here. This first one is five different categories inside some type of science. I’m wondering, does anyone know what these topics might be, looking at the trends?
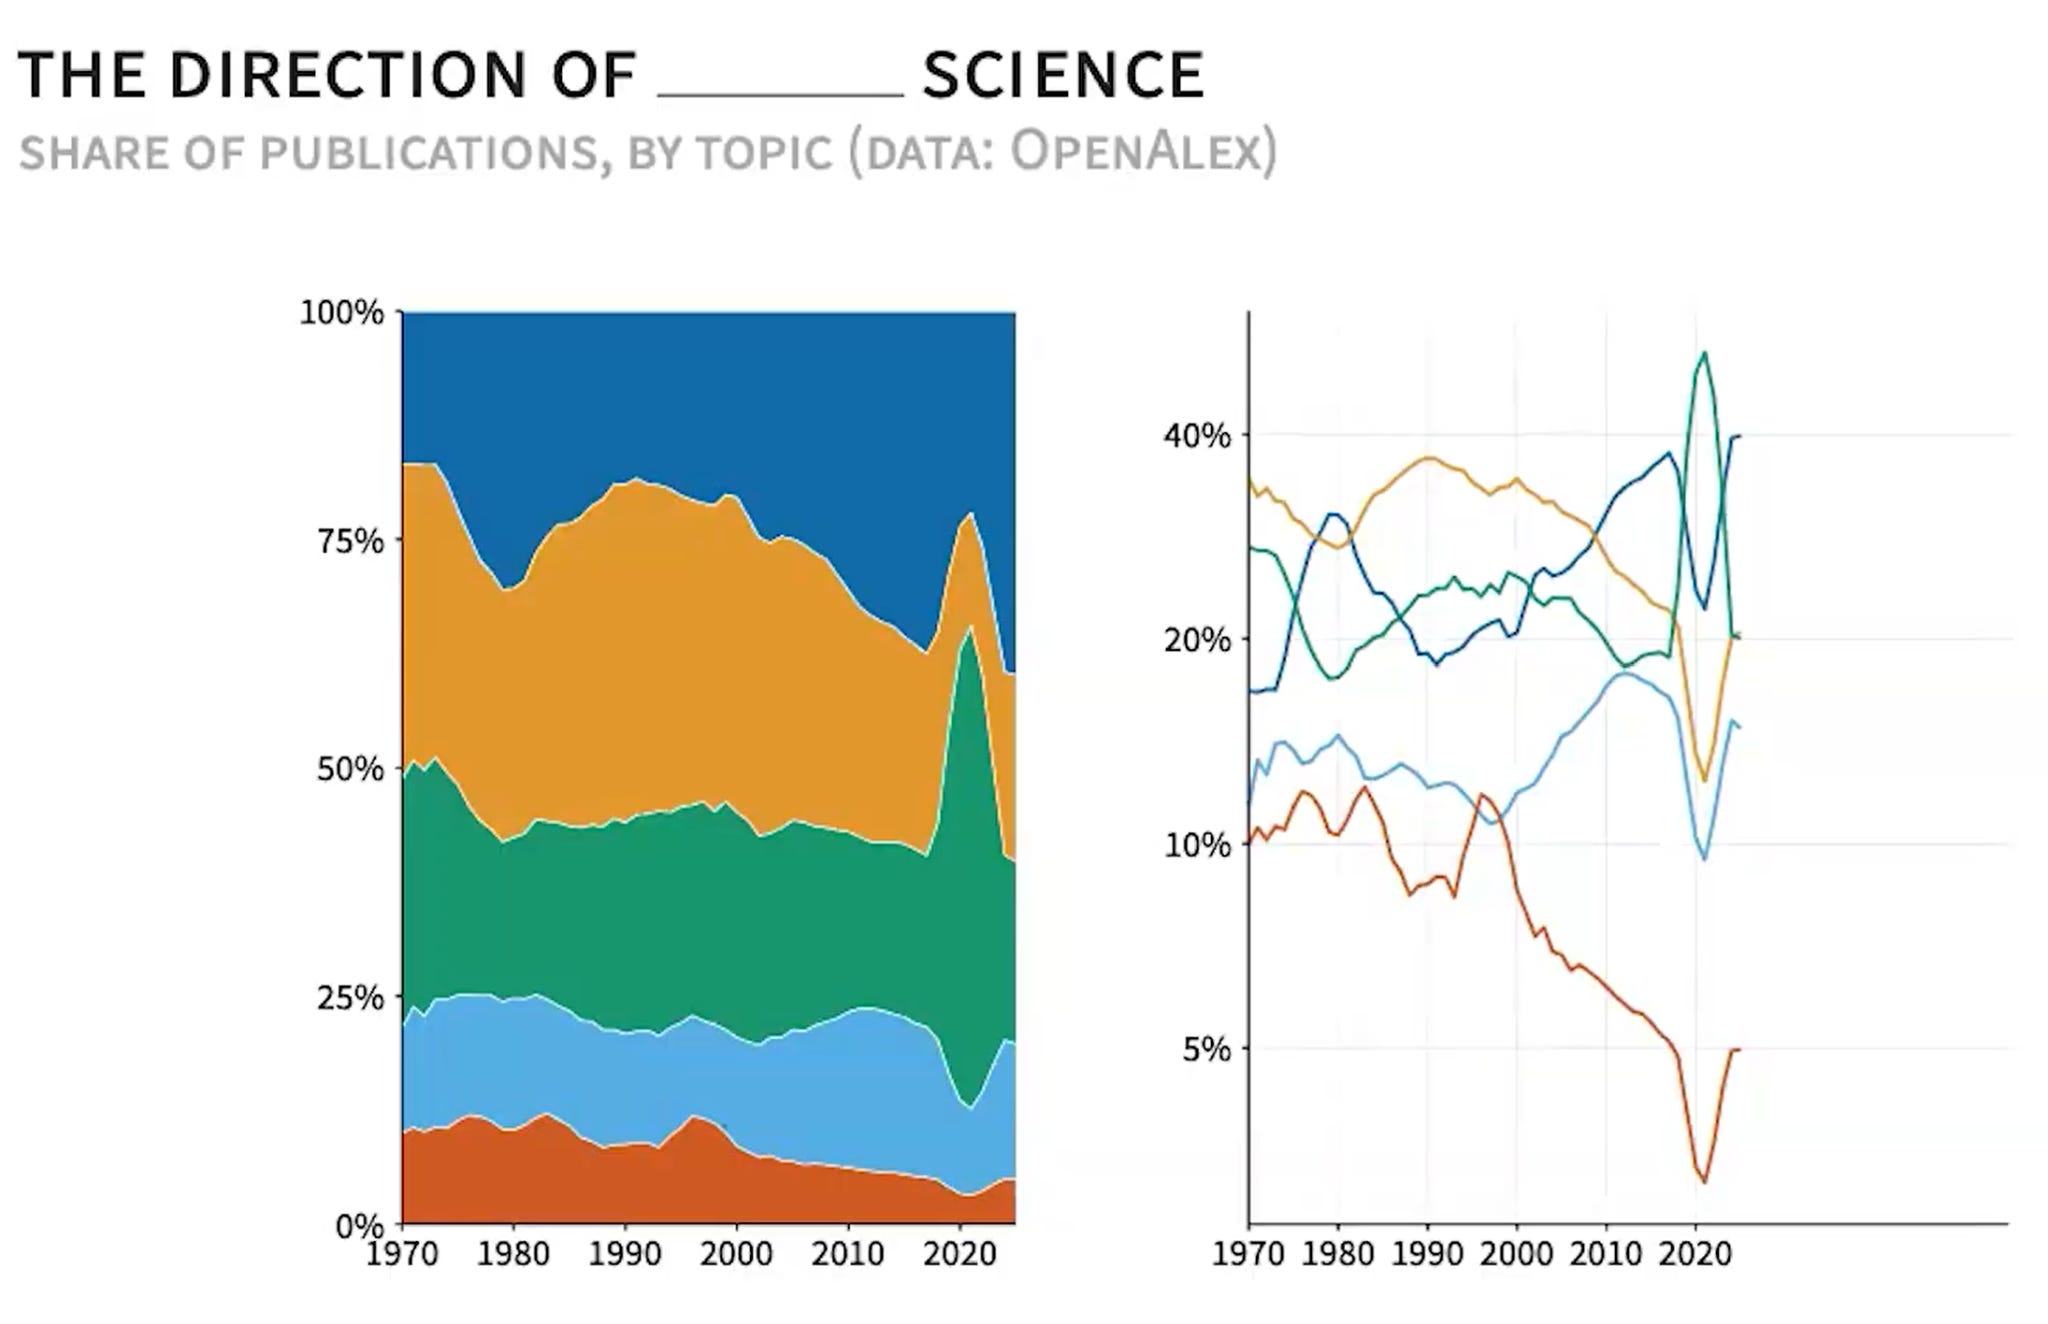
This is energy science.
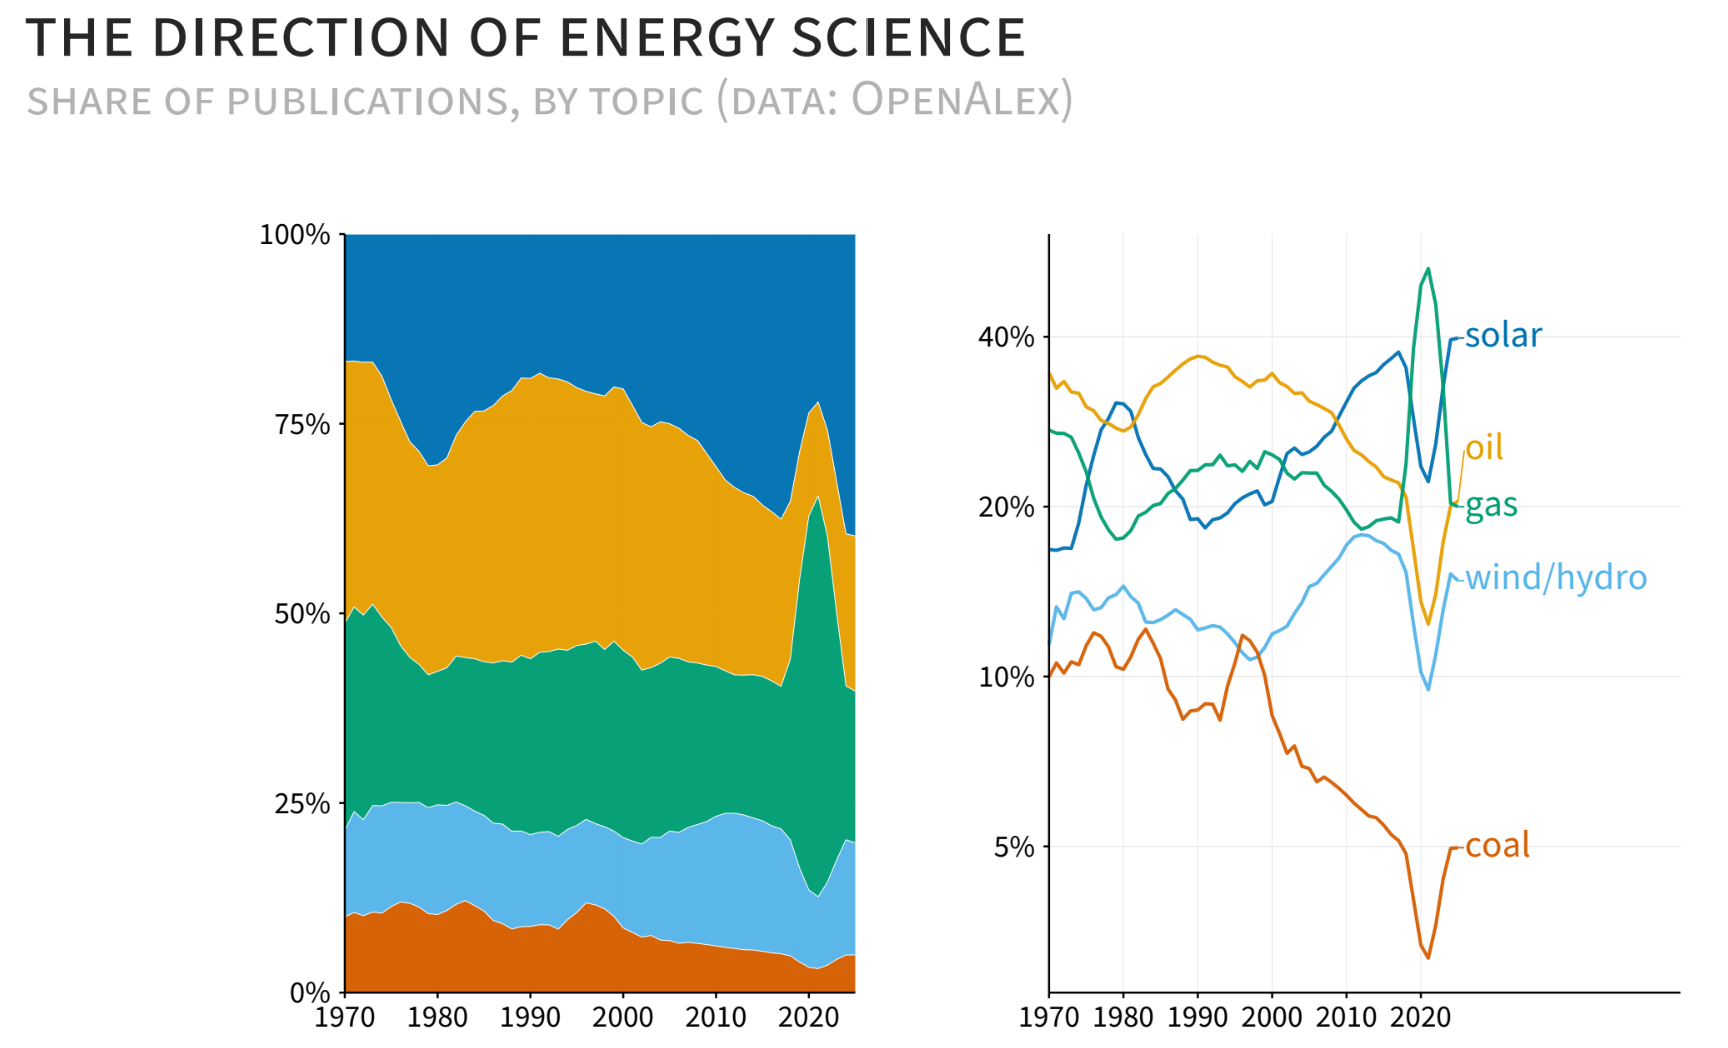
You could see a very interesting boom in research on natural gas in the tail end of the 2010s and around ye olde epidemic. There were some interesting technological developments with respect to fracking and what it could do in good ways and also possibly in bad ways. You can see, as it expanded, the different areas that it ate into.
Here’s another one that also has a bit of a surge right around 2020.
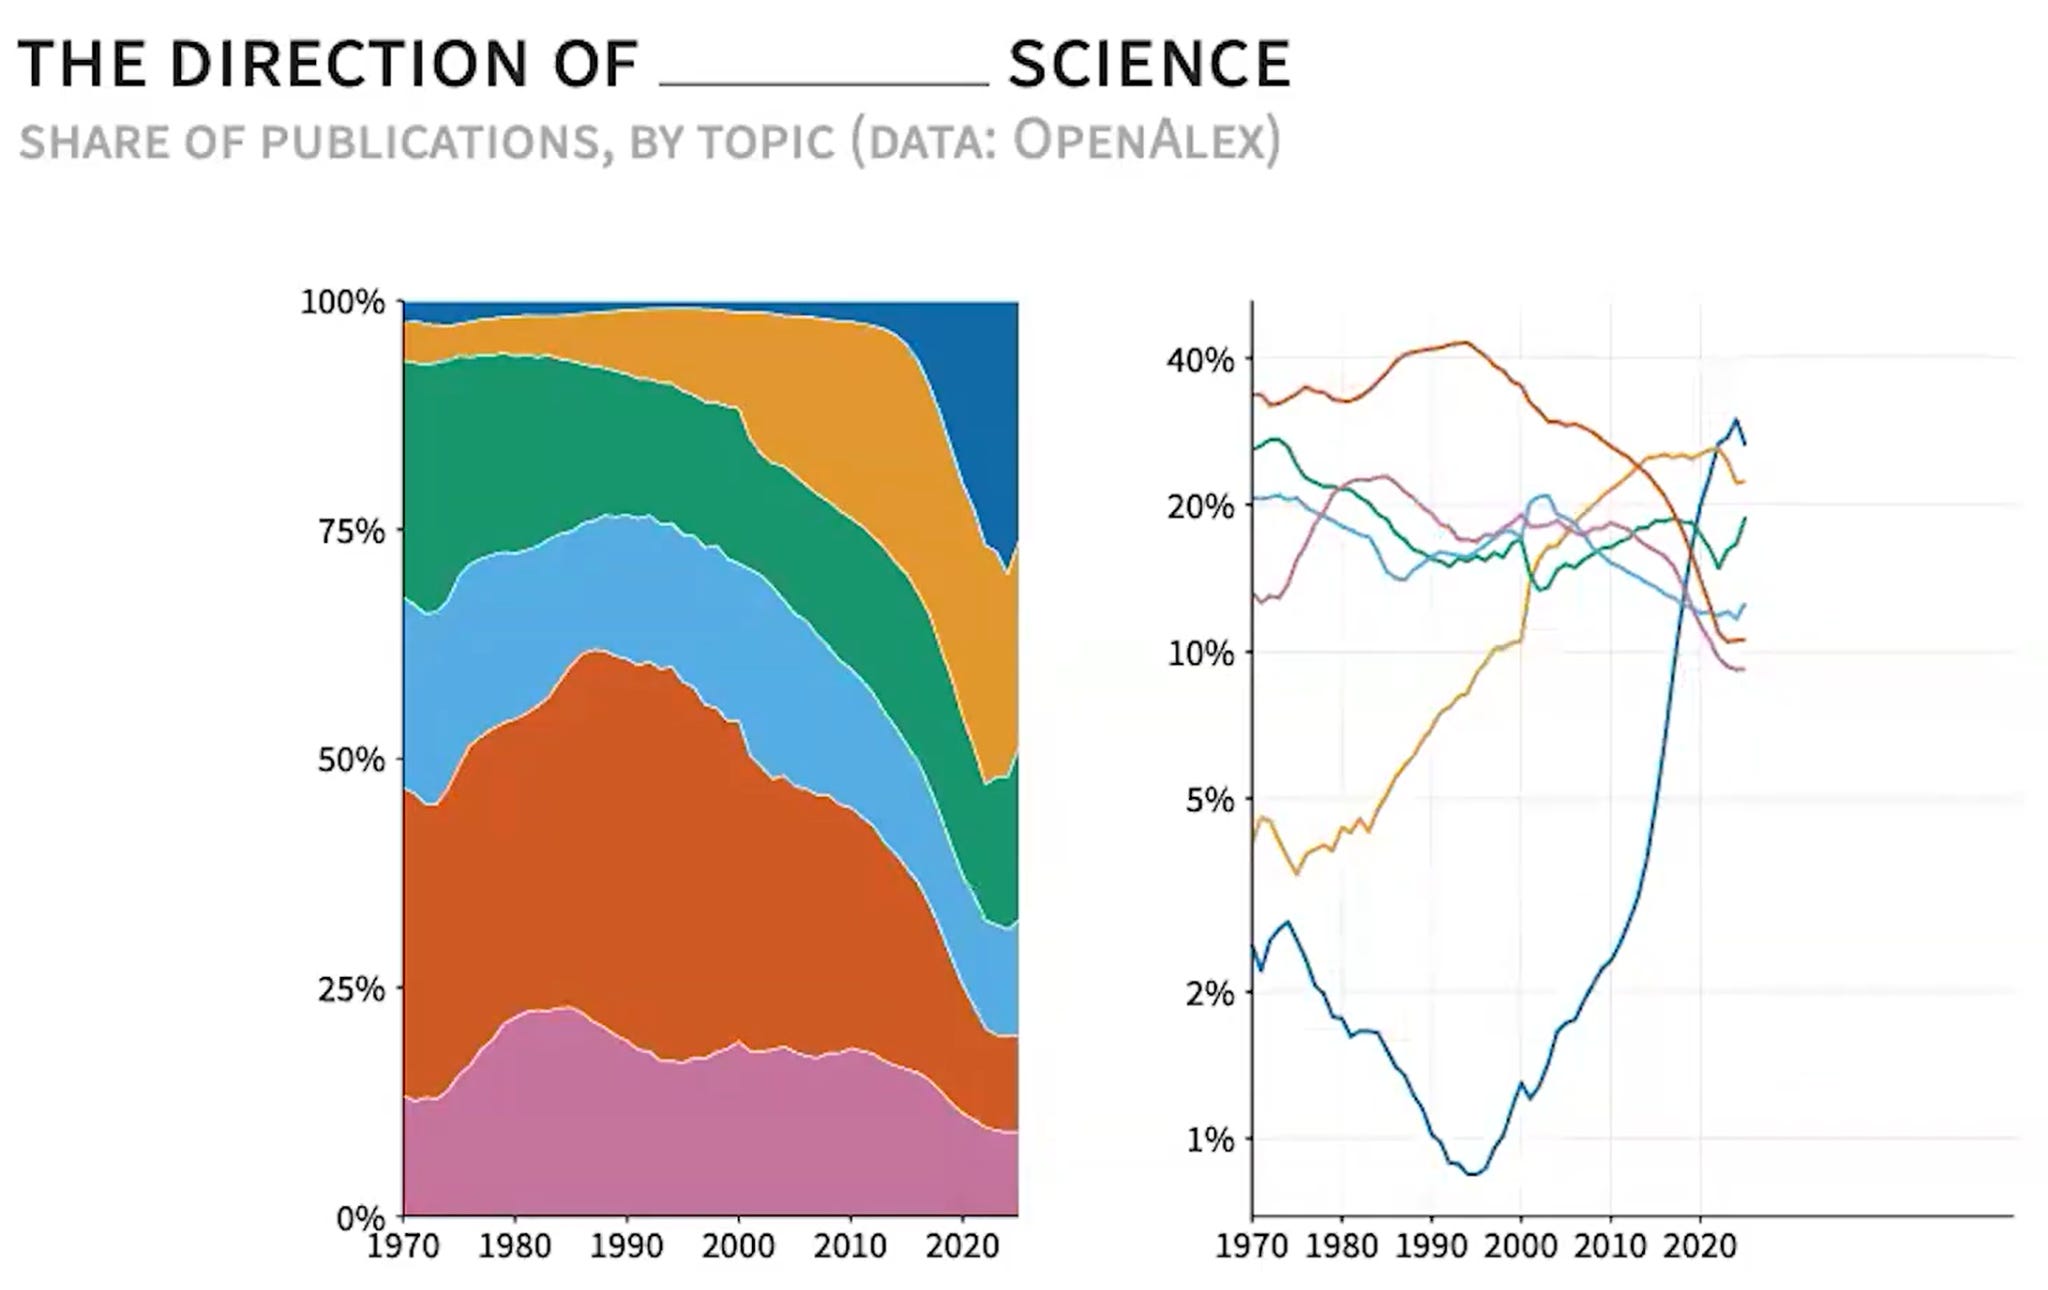
You’re probably thinking it’s one thing — this is computer science.
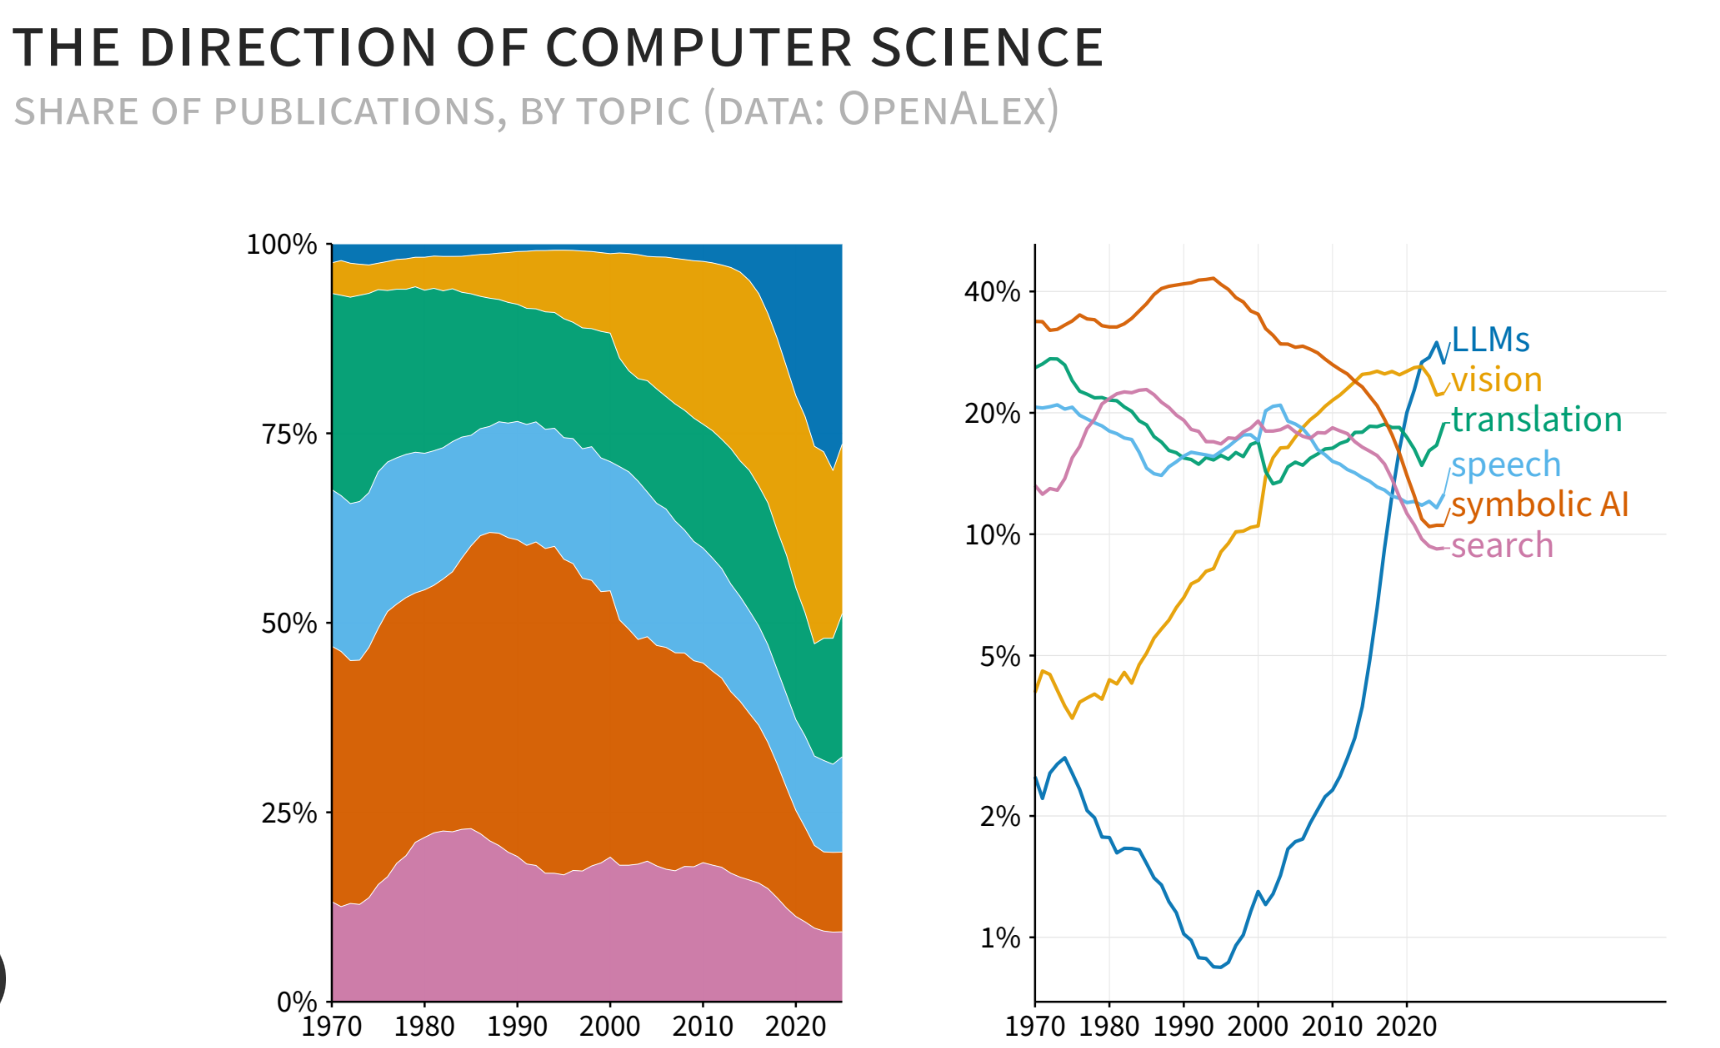
That surge is not COVID. That’s large language models. If you broadly define artificial intelligence, very broadly speaking these are five things going on over the past 50 years. You can see the large language models — there were people talking about them back in the ‘70s and ‘80s, but it wasn’t until very recently... You can see they’ve totally dominated, in particular symbolic AI. Symbolic AI is, as opposed to the stochastic approach of most large language models, symbolic AI was a — “We’re going to hardcode a very mechanical, deterministic system and see if we can use that approach to develop intelligence.” It hasn’t faded completely away, but you can see most people these days work on LLMs.
Now this is the one that you probably thought the other two were.
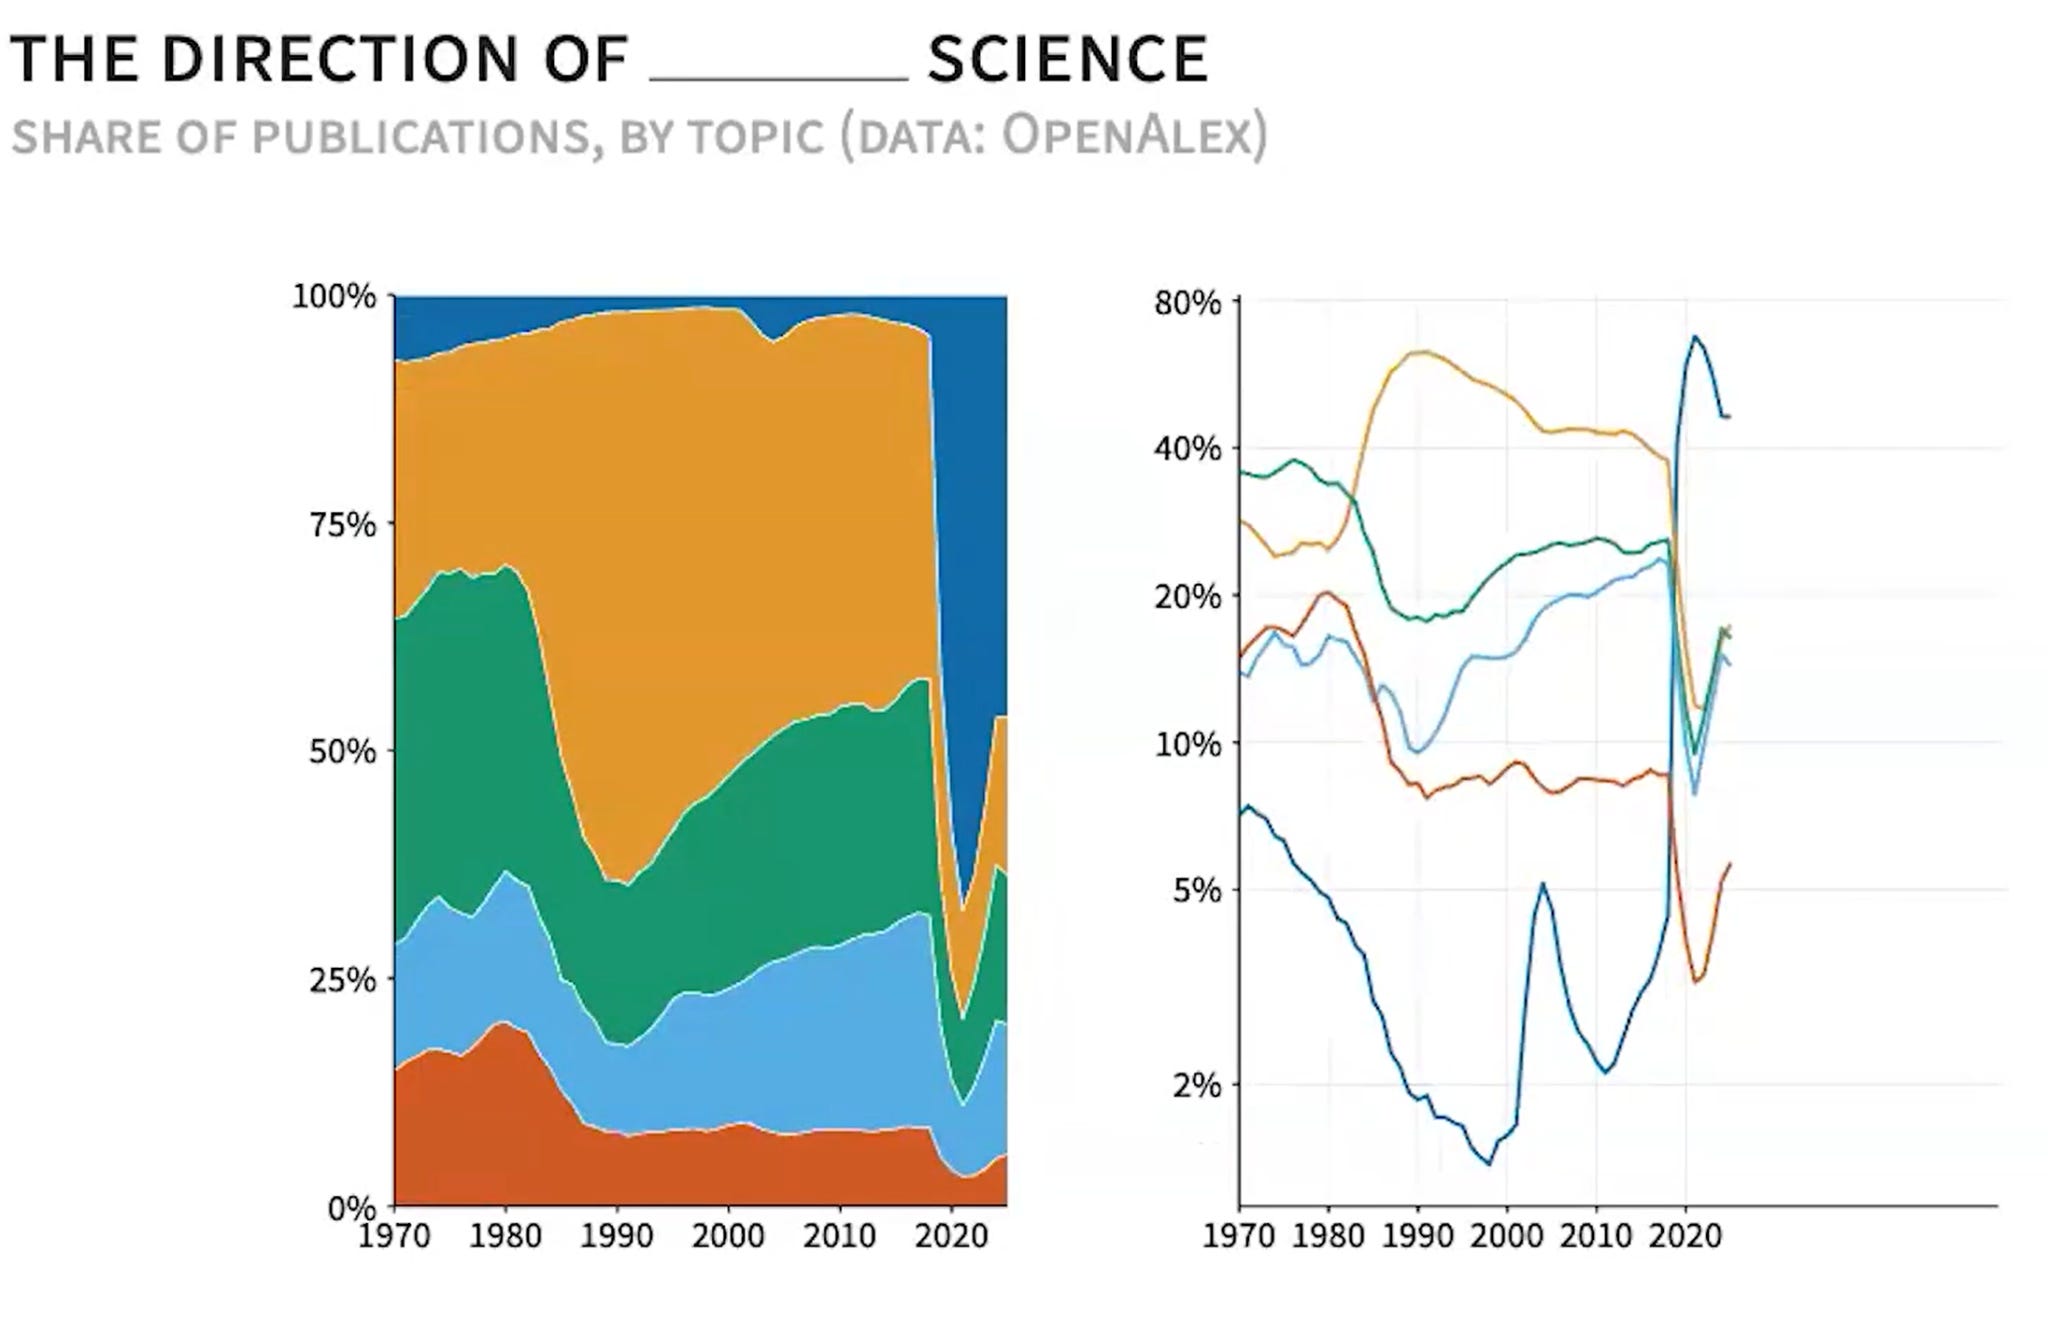
This is a look at disease science over that same period.
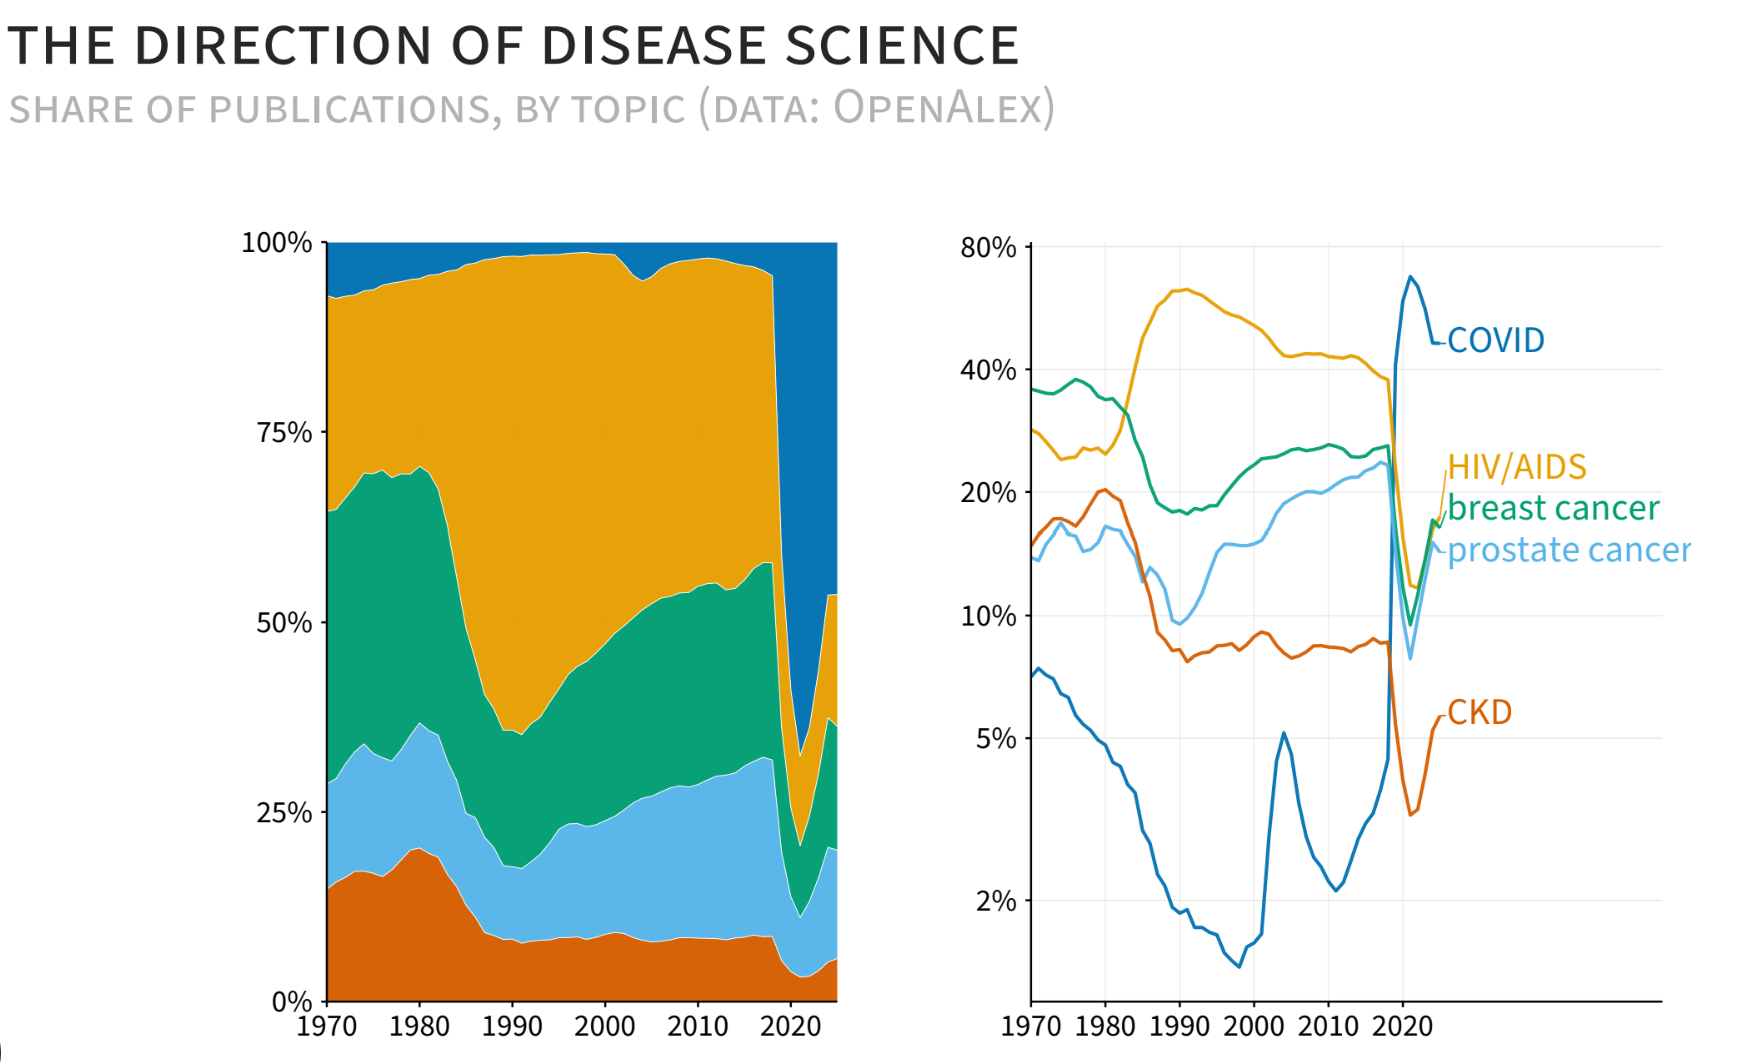
You can see there are two interesting things in this data. One is the HIV/AIDS epidemic occurring in the ‘80s and drawing a lot of resources, resulting in a large growth in the publication share. These are shares within these different categories — this isn’t shares across all of science. Then you can see, unsurprisingly, the research on coronaviruses and COVID-based diseases spiking with the pandemic, and still a lot of research going on in that space today. This data goes up till about 2023, where it’s nice and reliable.
From outputs to inputs
Those were outputs, looking at the direction of different kinds of outcomes: publications. All the money has been invested, the papers have been written. A lot of what I want to talk about today is the input side: where do we put our investments, and what do we mean when we talk about managing the direction of science?
One way to think of that is investment in a very particular thing. For example, the ITER fusion reactor in Europe is a joint venture that started in 2006. This is my favorite example of a large-scale targeted research investment that is not going quite according to plan. Twenty years into this project, we’re now 15 years behind schedule and about €15 billion over budget. This is an emblematic example of the difficulties of knowing how much things are going to cost in the world of frontier science and managing that.
Now I’m going to tell this in a way that gives you a much more optimistic lens on intervening in the direction of science, although in truth I make no causal claims with this graph. But it is a fun graph. In 1960, 1970, the National Cancer Institute (NCI) did exist but was very weakly funded, on the scale of maybe $100 million per year, and cancer mortality was on the rise. In 1971, Richard Nixon starts the war on cancer, and it leads to a large and sustained boost in funding for the National Cancer Institute. Was the war on cancer winning? Unclear. We kept spending a lot of money.
In 2008, David Cutler, whose approach I’m drawing very much from, wrote a very nice paper that says, Are We Finally Winning the War on Cancer? The beautiful graph he has, which I’ve replicated here, shows a dramatic decline in age-adjusted cancer mortality in the United States.
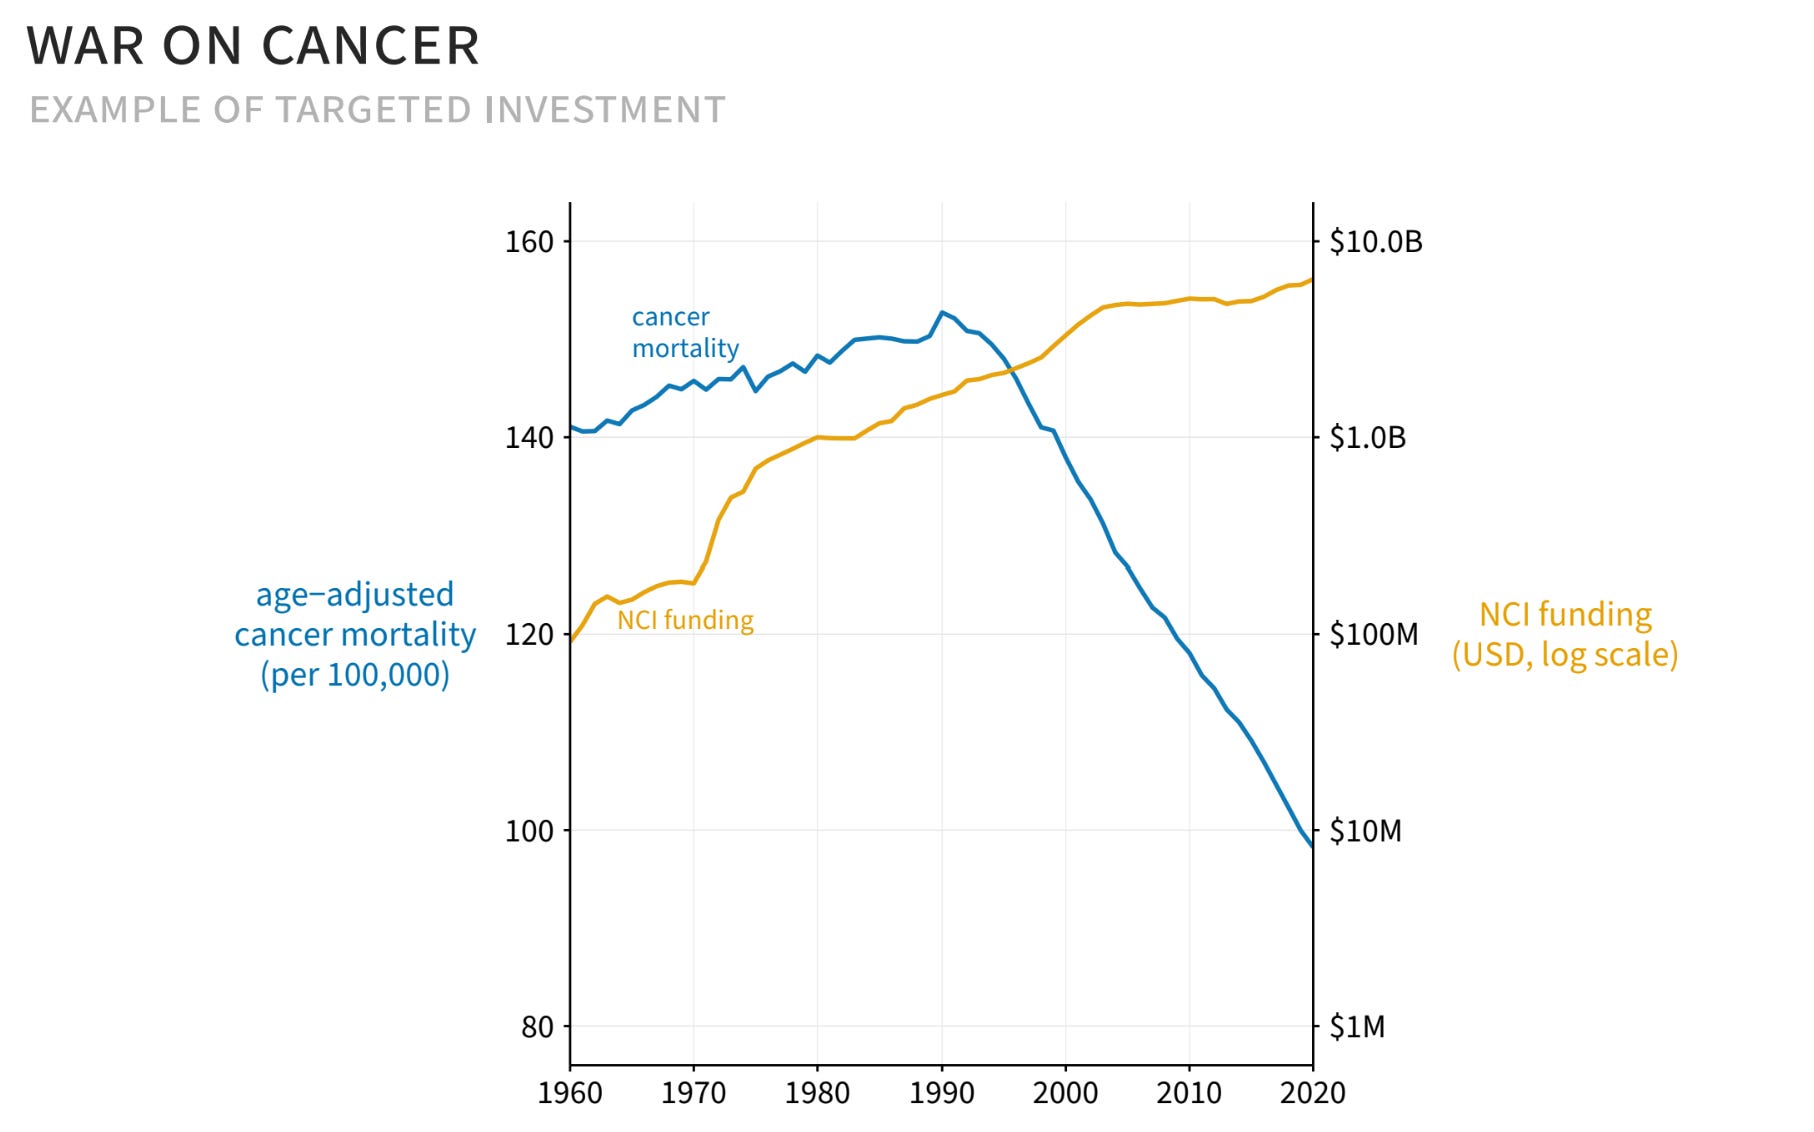
How much of that is purely due to lung cancer survival rates going up because people are not smoking as much, and how much do you want to attribute to the NCI? These are tough questions. Your eyeball wants to give it all to the NCI, but also — I don’t know, it started to pay off after 30 years. Maybe this was a large portion of it. We don’t know. A lot of the frontier questions people are asking right now are: what are the returns on investments in these targeted programs?
Spending at the NIH
We’ll spend a bit of today on the US National Institutes of Health (NIH), both because it is large dollar-wise and because it’s a place that has some empirically useful features for studying.
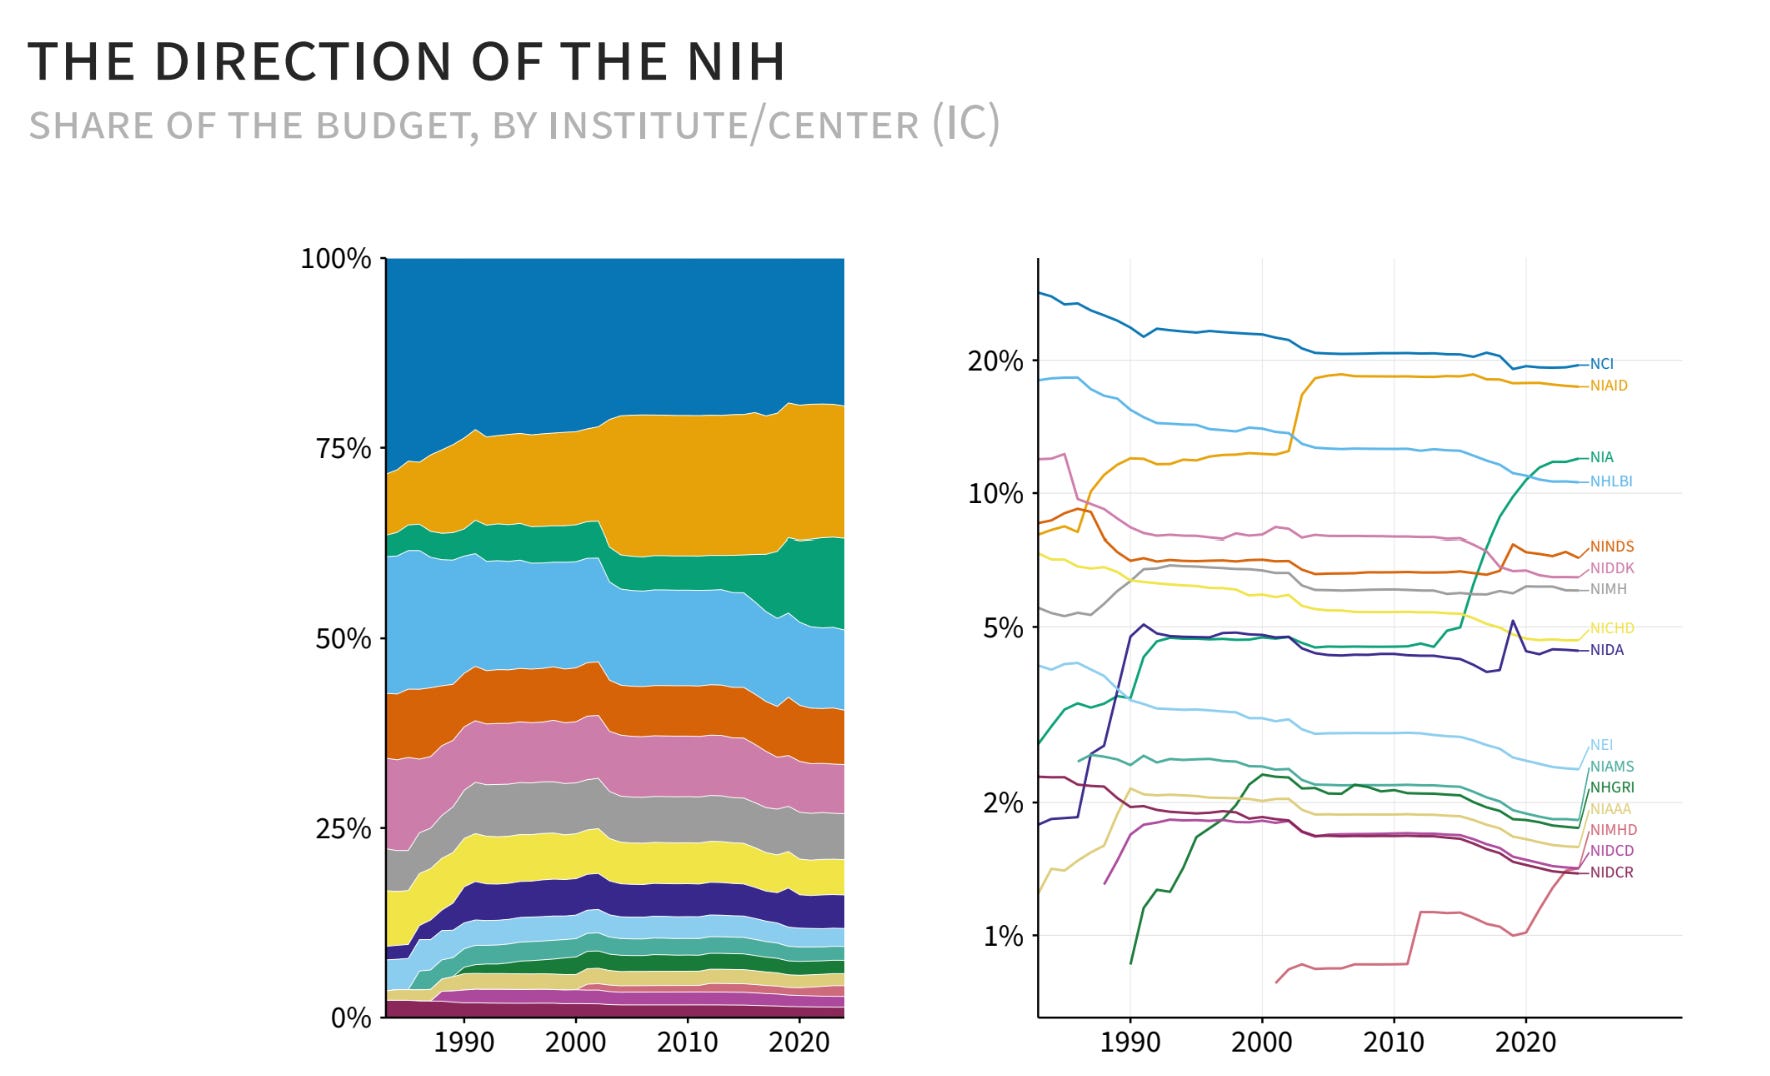
This is the share of the budget going to each of the major institutes and centers of the NIH as a fraction of the total NIH budget. You can see some interesting trends and changes there in terms of where our tax dollars are going.
There have been a lot of papers where people take that data and plot it against something like disease burden. That comes from a notion that, even if you’ve never taken an econ course, your brain sees that spending and says, “I hope we’re spending money where there’s a lot of need for scientific advances.” I’ve drawn a 45-degree line, which represents what it would look like if, for every 1% increase in burden that these diseases have on the US economy, we would spend 1% more dollars on that disease.
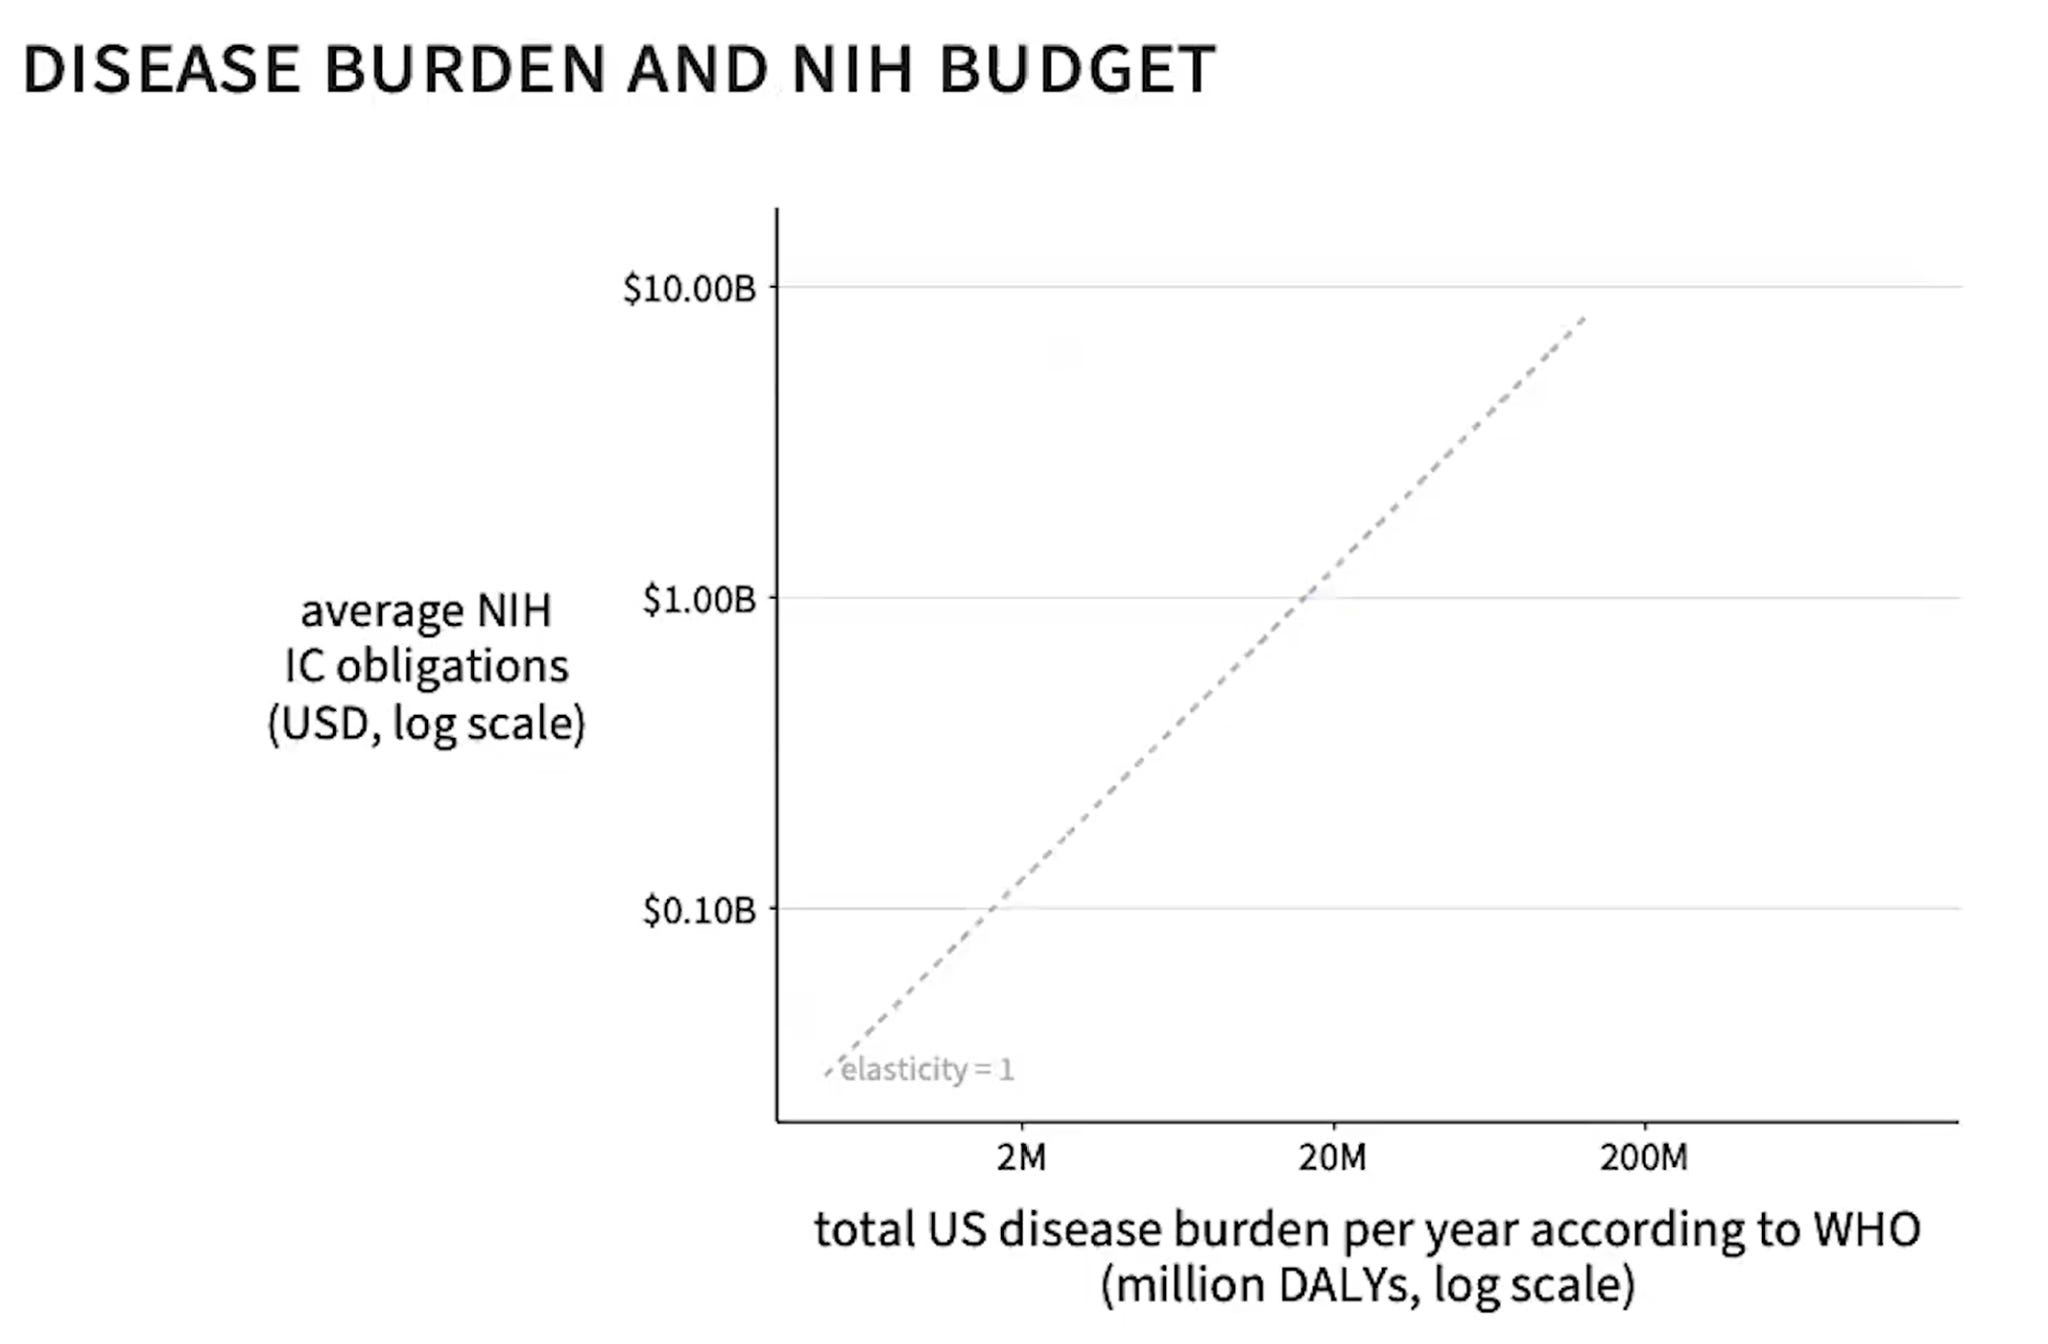
Now I’m going to show you the data.
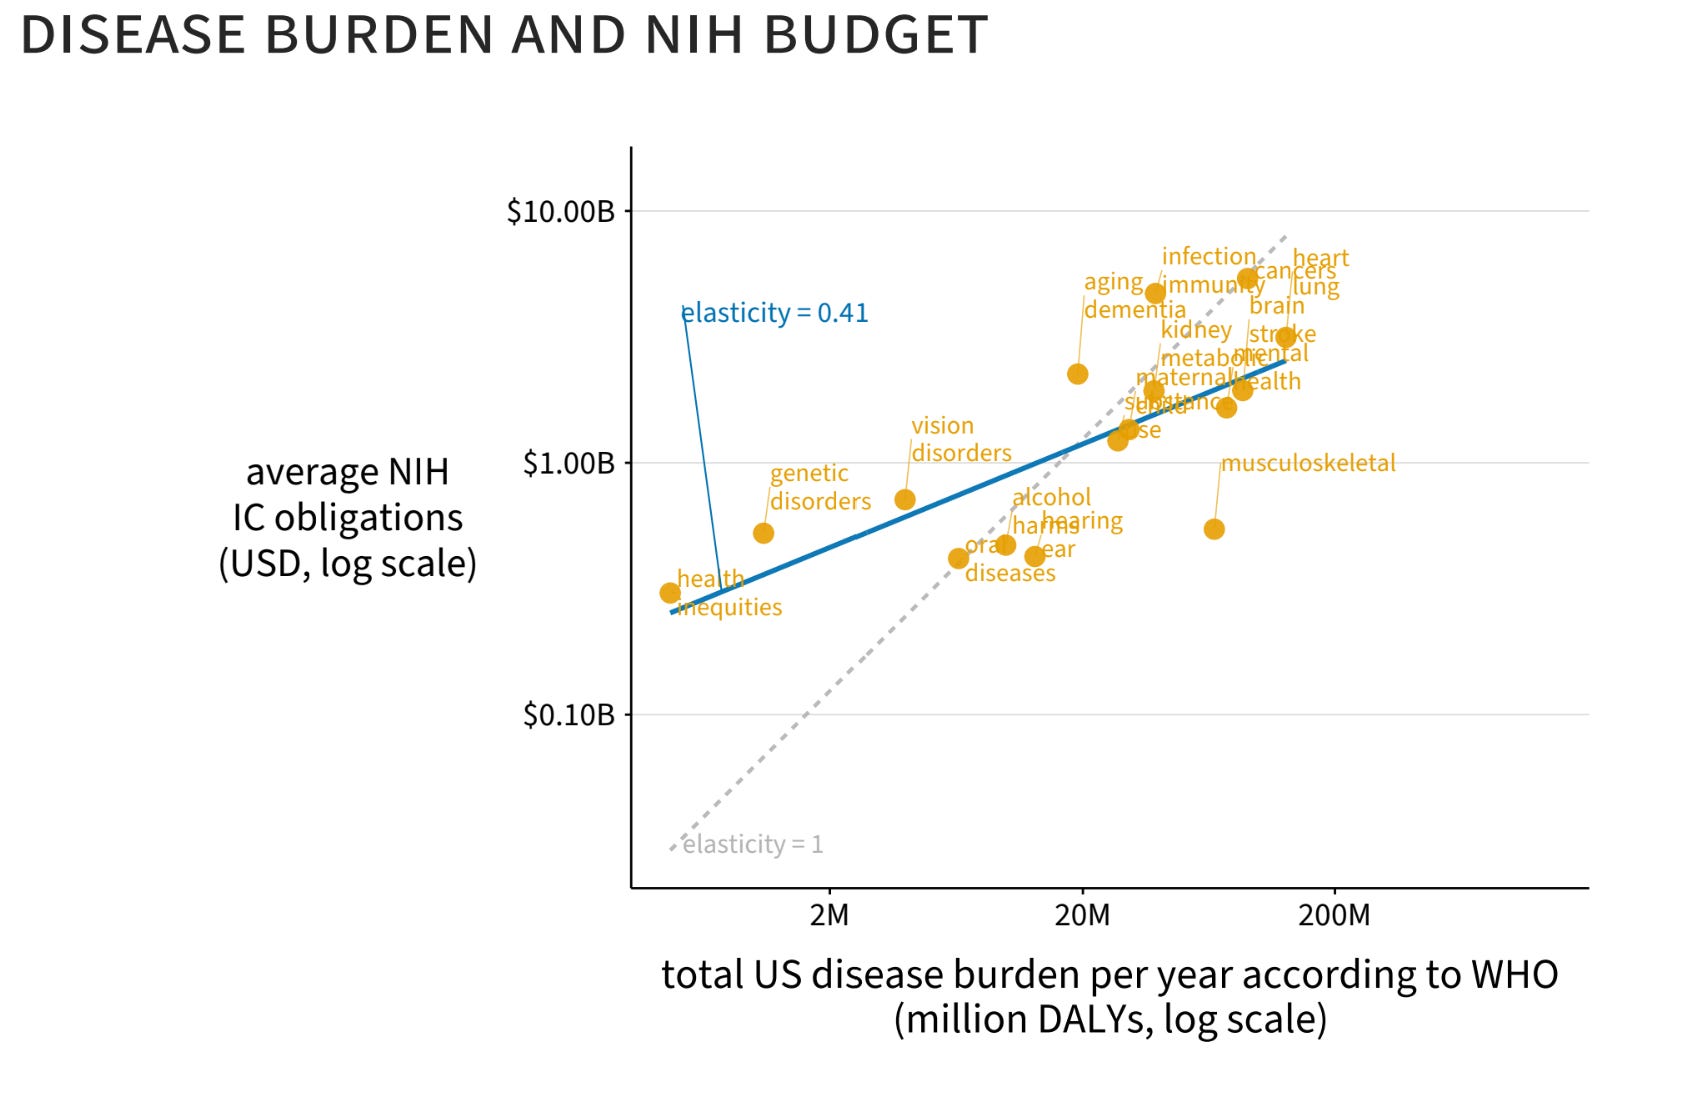
The real elasticity is not one. It’s 0.41. It’s positive. We do spend more money on diseases with larger burden, per WHO disability-adjusted life years, but it’s not a 1% increase.
What should it be? These are interesting and difficult questions, and the kinds of things we’ll be talking about in our lecture today. We’ll come back to this graph at the very end, thinking about — if we took the World Health Organization estimates as the true measure of disease burden, what is the source of the residuals from this line? Why is musculoskeletal so far below the average trend? Why are genetic disorders, or aging and dementia, a little bit above? Is that due to distortions or frictions in the political budgeting process, or is it due to research on dementia being very productive right now? Another reason you will invest in one topic and not another is because every dollar you invest gets you more. So holding fixed demand, you always have to think about supply: the classic econ challenge of separating supply and demand curves.
Outline for today
We’re going to proceed in three parts:
A very high-level, institutional-level focus on how budgets are set, as far as we can understand them.
A more micro-level look, thinking about scientists’ response to decisions made by scientific institutions.
A discussion of some frontier theories about how this works. As evidenced by those empirical charts I showed you before, doing empirics on some of these questions is quite challenging. It would require a counterfactual not war on cancer. For those of you who are empiricists in the crowd, it’s hard to find the right control group for the war on cancer. This is a place where we do need to try to rely on theories when we can.
Who determines the direction of science?
A shout out to Bhaven Sampat, who introduced me to these two fellows, one of whom is the author of the first paper we’re going to discuss. On the left is Vannevar Bush, and on the right is Harley Kilgore.
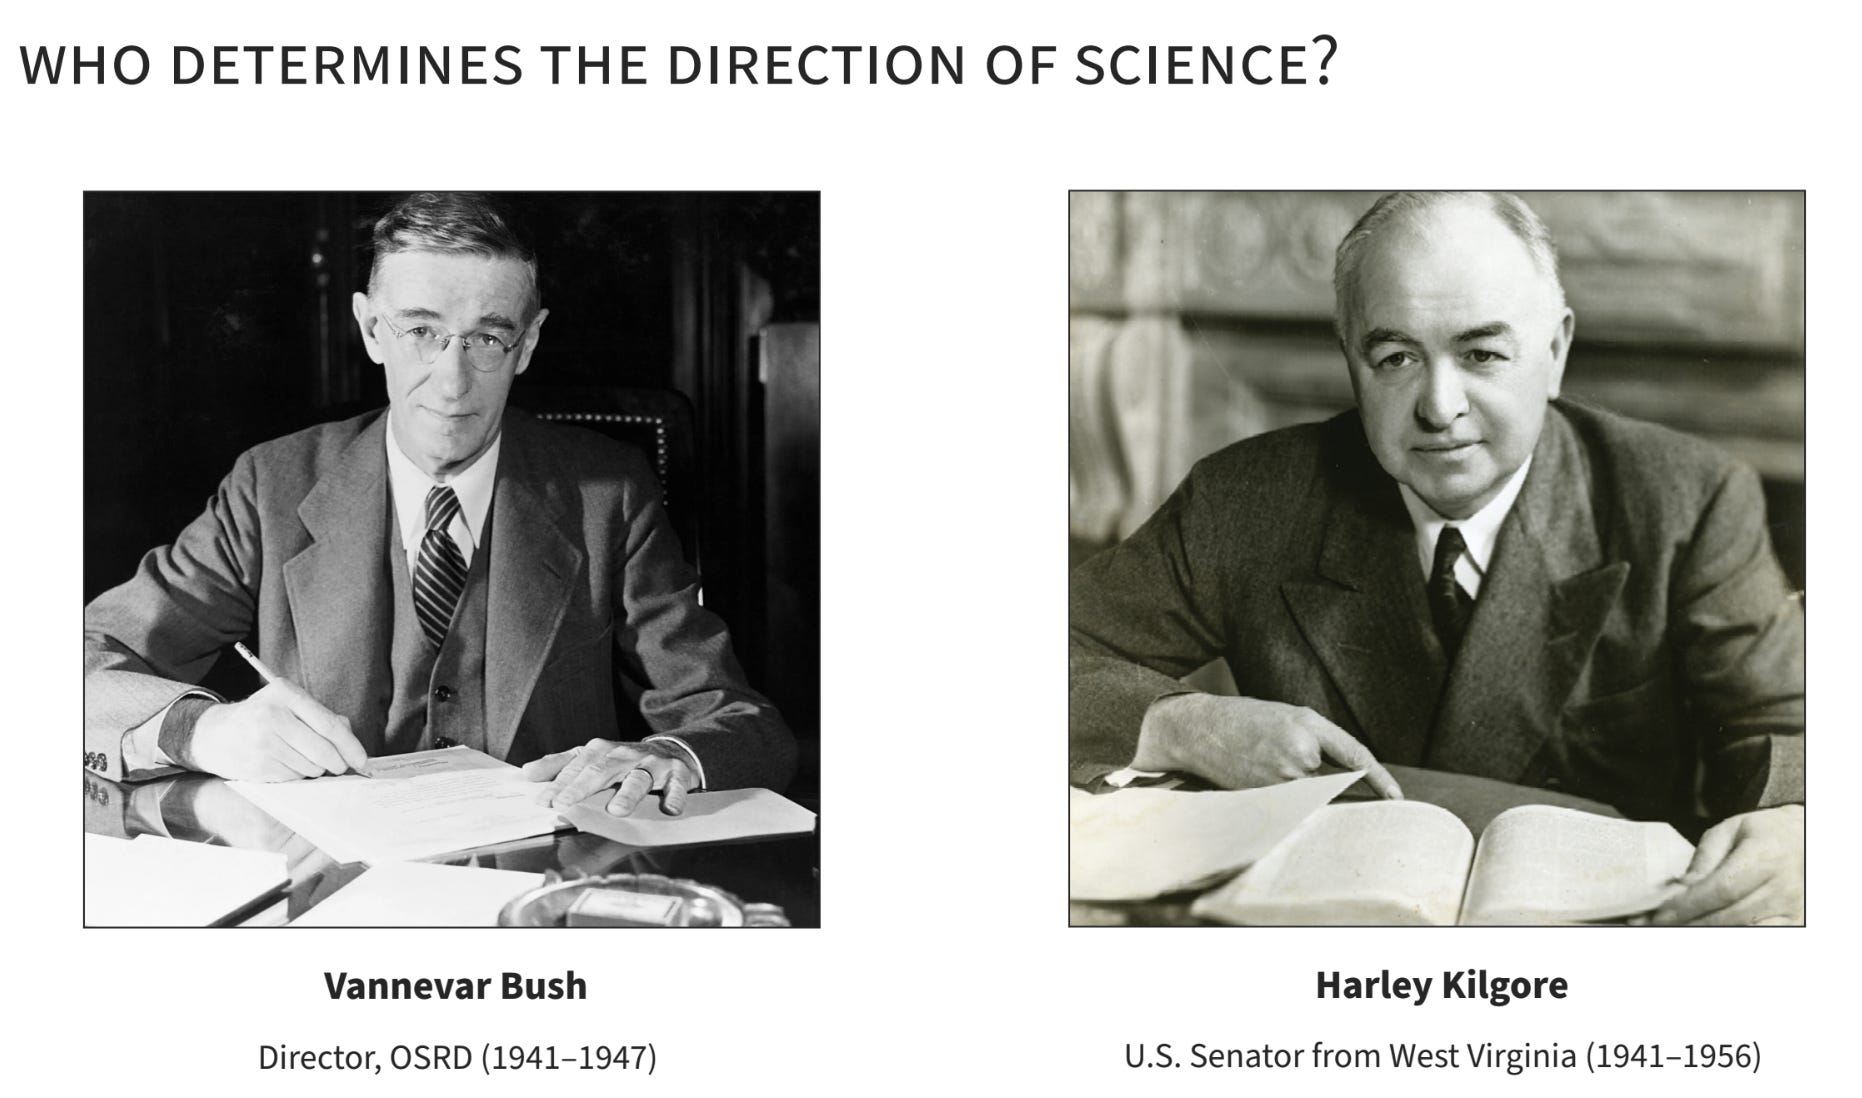
Vannevar Bush was the director of the Office of Scientific Research and Development during World War II and wrote a very famous memo called Science: the Endless Frontier that founded the National Science Foundation and laid the groundwork for a lot of science policy in the United States. He was a scientist himself at MIT, and as most scientists will say, his answer was, when in doubt, just give the scientists the money and let them figure out what to do with it. That was his answer to the question, who should determine the direction of science?
Harley Kilgore was a senator from West Virginia, a very sharp man who saw what was happening after World War II as the NIH and the NSF started to scale up and thought, “Not so fast, Mr. Bush. Perhaps the public and our policy institutions should have a bit more sway over where this funding is going, because you scientists like to do things that you like to do, which may not be in line with the public’s best interest.” The Bush–Kilgore debates were rampant in the ‘40s and ‘50s, and in today’s political climate have come back into popularity.
Disease group lobbying and the NIH
The first paper that I want to spend a little bit of time discussing was this nice paper by Deepak Hegde and Bhaven Sampat, Can Private Money Buy Public Science? Disease Group Lobbying and Federal Funding for Biomedical Research, which is still one of the better lenses looking at how much of the scientific funding in the United States gets influenced by political forces — in this particular case, disease group lobbying.
Before this paper, and even still now, a question is: how much does lobbying matter in practice? If you are interested in these political economy questions, there’s a terrific paper by John de Figueiredo and co-authors that has a terrific title, Why Is There So Little Money in Politics? which gets at the question you can see in my numbers here: the government disperses a tremendous amount of money.
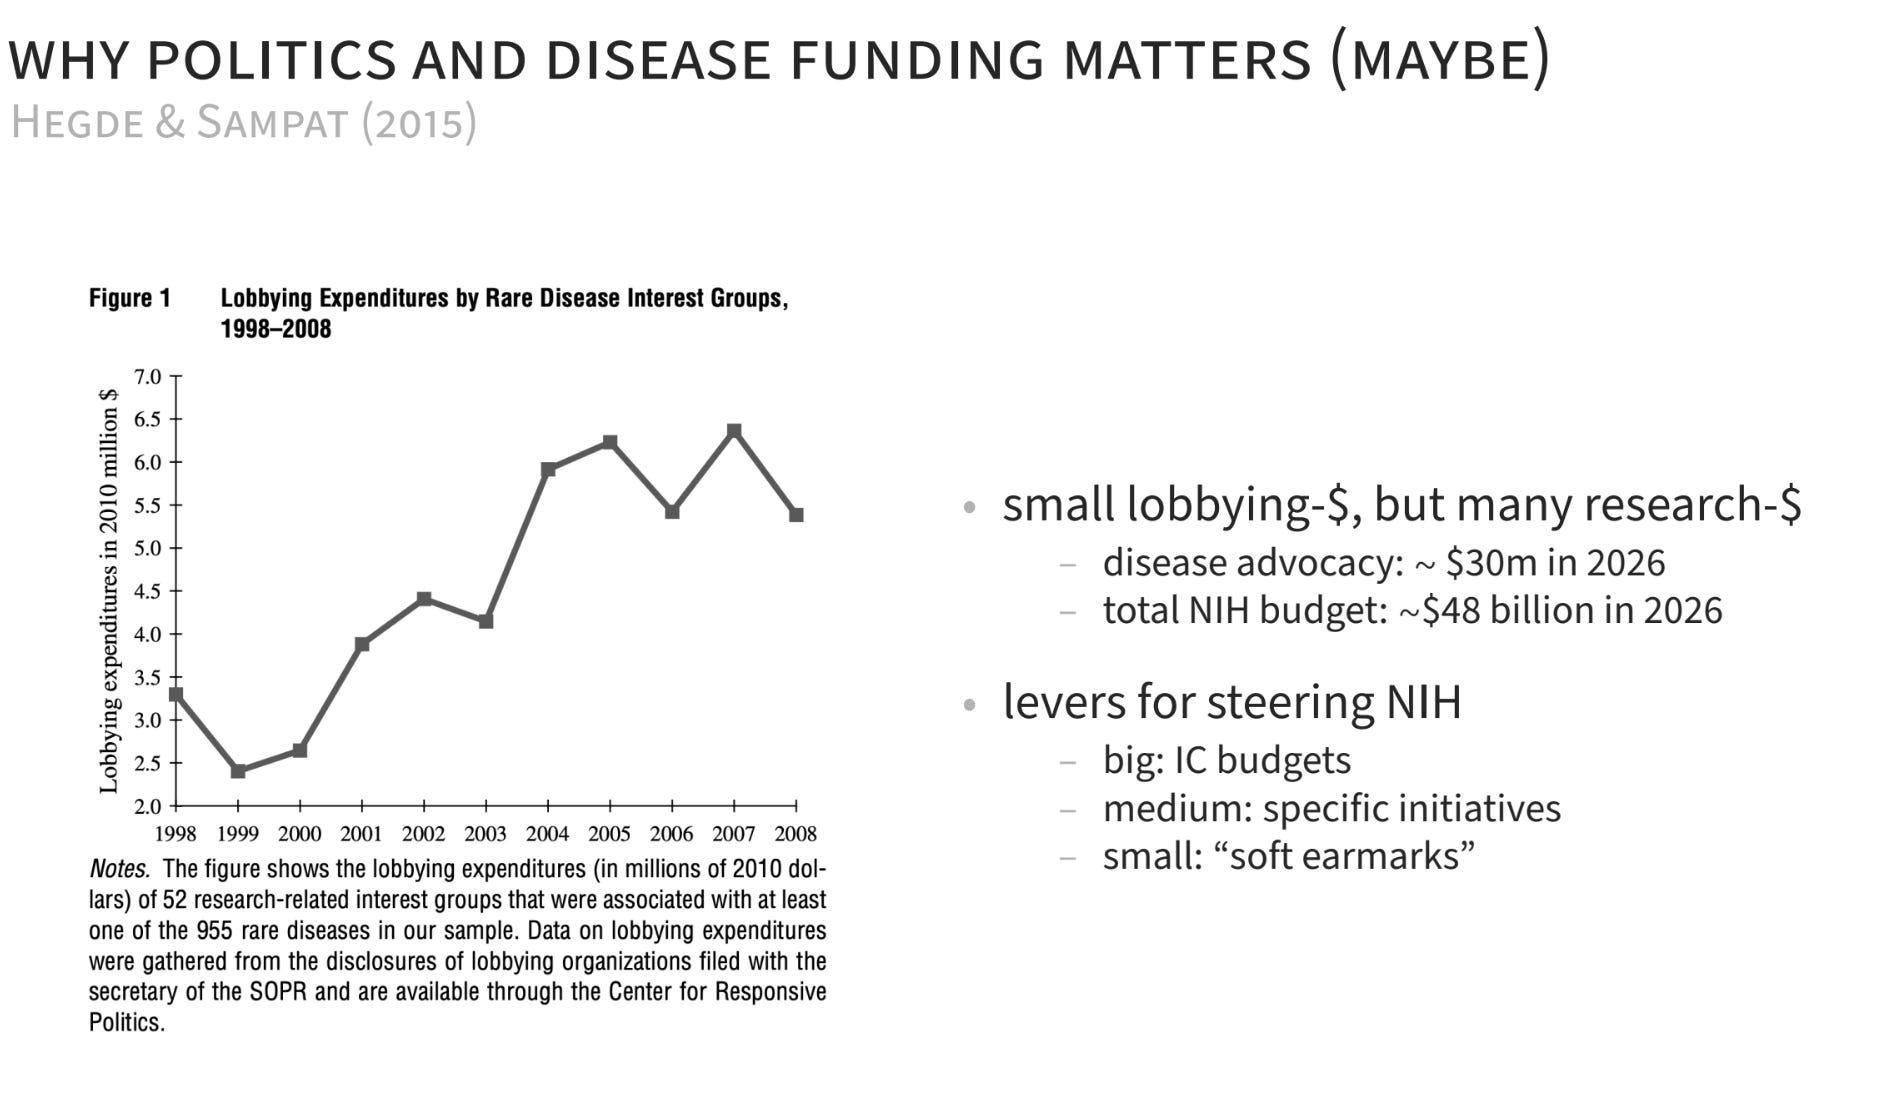
The NIH budget these days is approaching $50 billion. And yet — these numbers were based on me working with Claude for a few hours to try to figure out the most up-to-date numbers about the size of disease lobbying — we got to an estimate of about $30 million. That’s many orders of magnitude different. But an interesting question is always, perhaps the returns to those dollars are very steep at first and then become very flat, and so we still want to know: are those dollars influencing where our public investments are going?
Before we jump into it, it’s important to think about how those dollars could influence. We’re a lobbyist. We pay money and spend time with the senator and tell them that the disease we are interested in is very important and more resources should be allocated to it. How could the senator from West Virginia influence that?
One way is by setting the budgets of the institutes and centers, which is an explicit mechanism that Congress has control over. They say the NCI budget is a certain amount of money. Another is they could try to fund specific initiatives. In the case of the NIH, this is actually quite rare. Most of the congressional authority comes through the institute and center (IC) budgets, although there are instances of some congressionally mandated set-asides. I believe Type 1 diabetes is one of these, which for you PhD students out there — I tried to look at that program because it has some interesting budget shocks. I never got too far, but that might be something interesting to look into, because it is one of the few congressionally mandated set-asides.
Then there are also these things called soft earmarks. This is clipped out of the 2024 appropriation language for the National Institute of Neurological Disorders and Stroke.
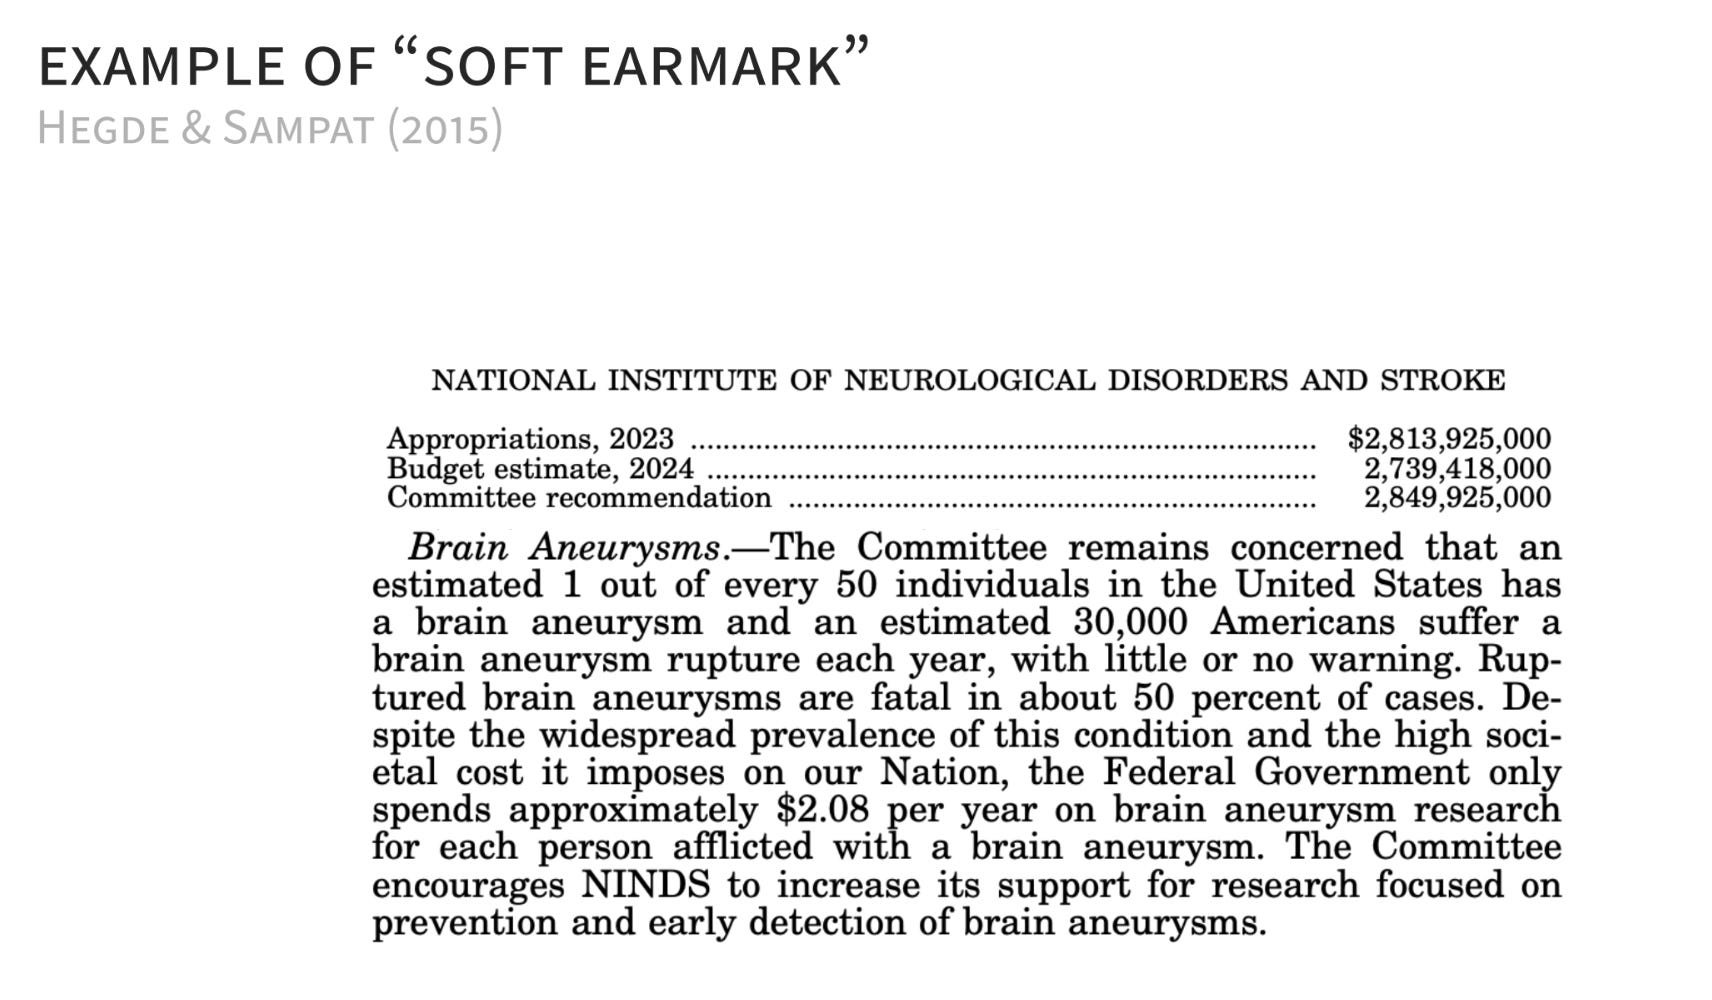
At the top, you can see the line item for this institute, and that’s the big thumb on the scale that Congress has power over. The challenge is, at a scale of multiple billions of dollars, it’s hard to move that number around.
Underneath these things, if you look in the appropriation language, you’ll see many paragraphs that look like what you see here, which will start with some disorder that Congress claims to be interested in. It’ll say things like, “The committee is concerned that one out of every fifty individuals has a brain aneurysm.” This is the soft earmark. It’s called soft because there’s nothing about this where Congress is saying you have to spend x amount of dollars on something. But it does go into the legislative record, and the NIH for sure is aware of these things, and the staffers on the Hill make sure the NIH is aware of them.
They have a number of regressions that I’ve done my best to set up as a nice little directed acyclic graph that we can just walk through, to see what this paper is finding is happening in the data. This is a three-stage event.
First, for every disease, you look out in the world and there’s some burden that it has on the population, some scientific opportunity, which we’re going to proxy with the number of publications on that topic, and some base rate of funding already going into that disease. The first question is: how do those things affect how much lobbying occurs?
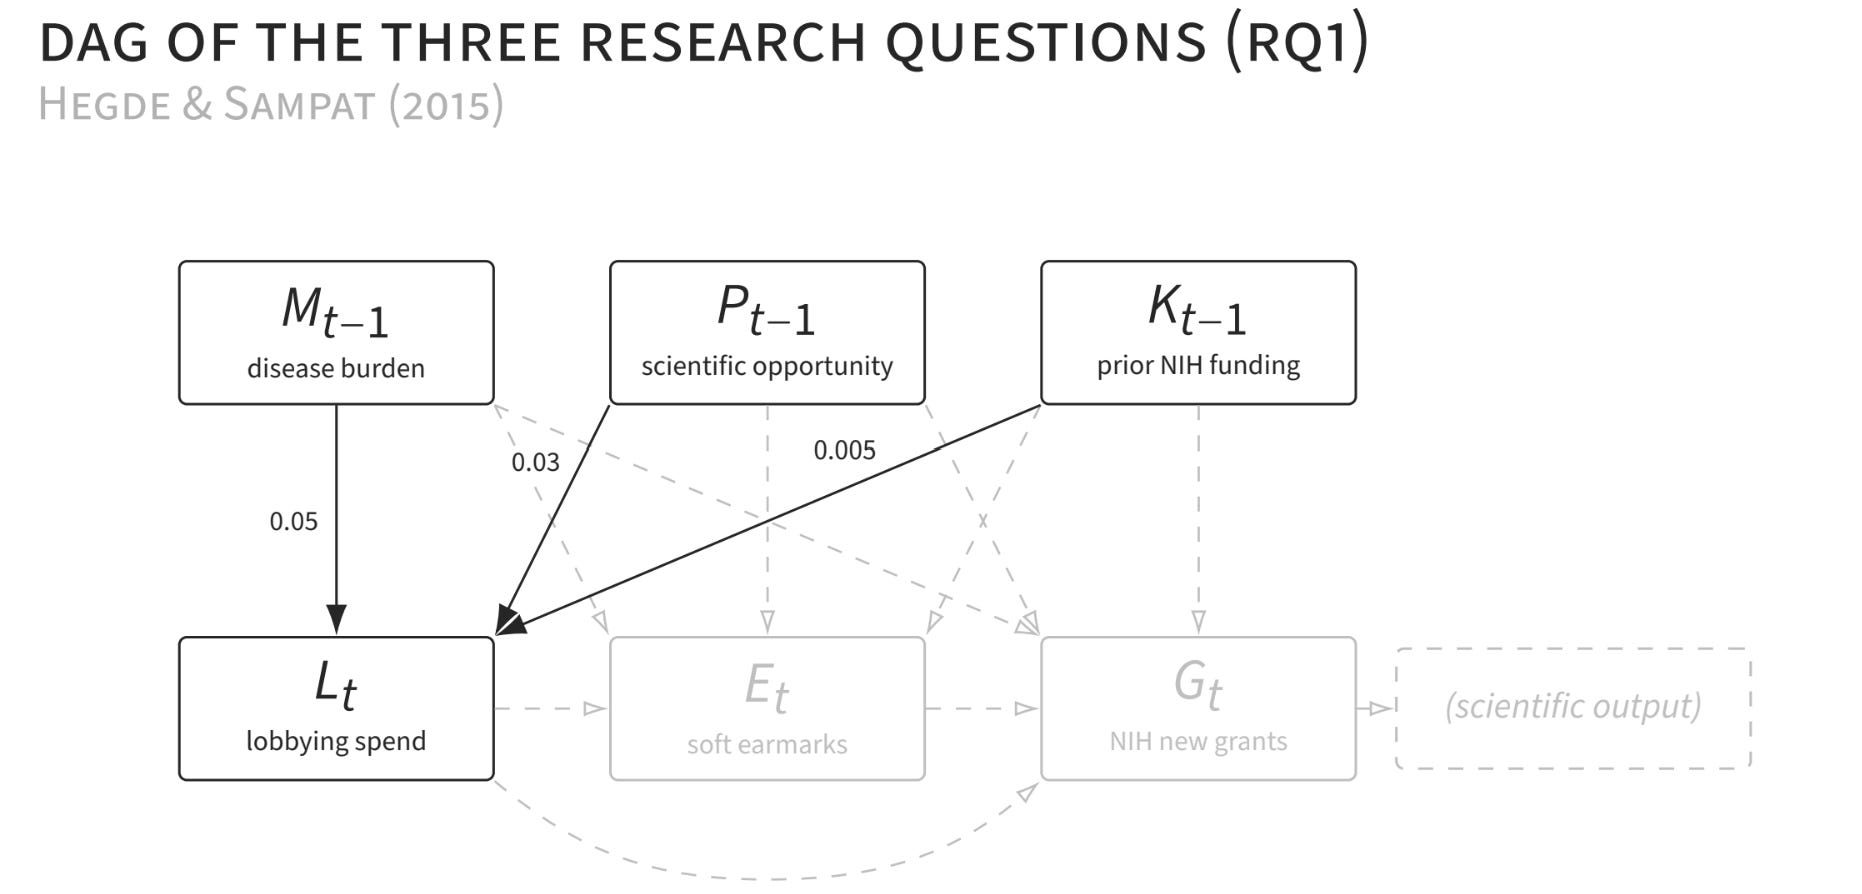
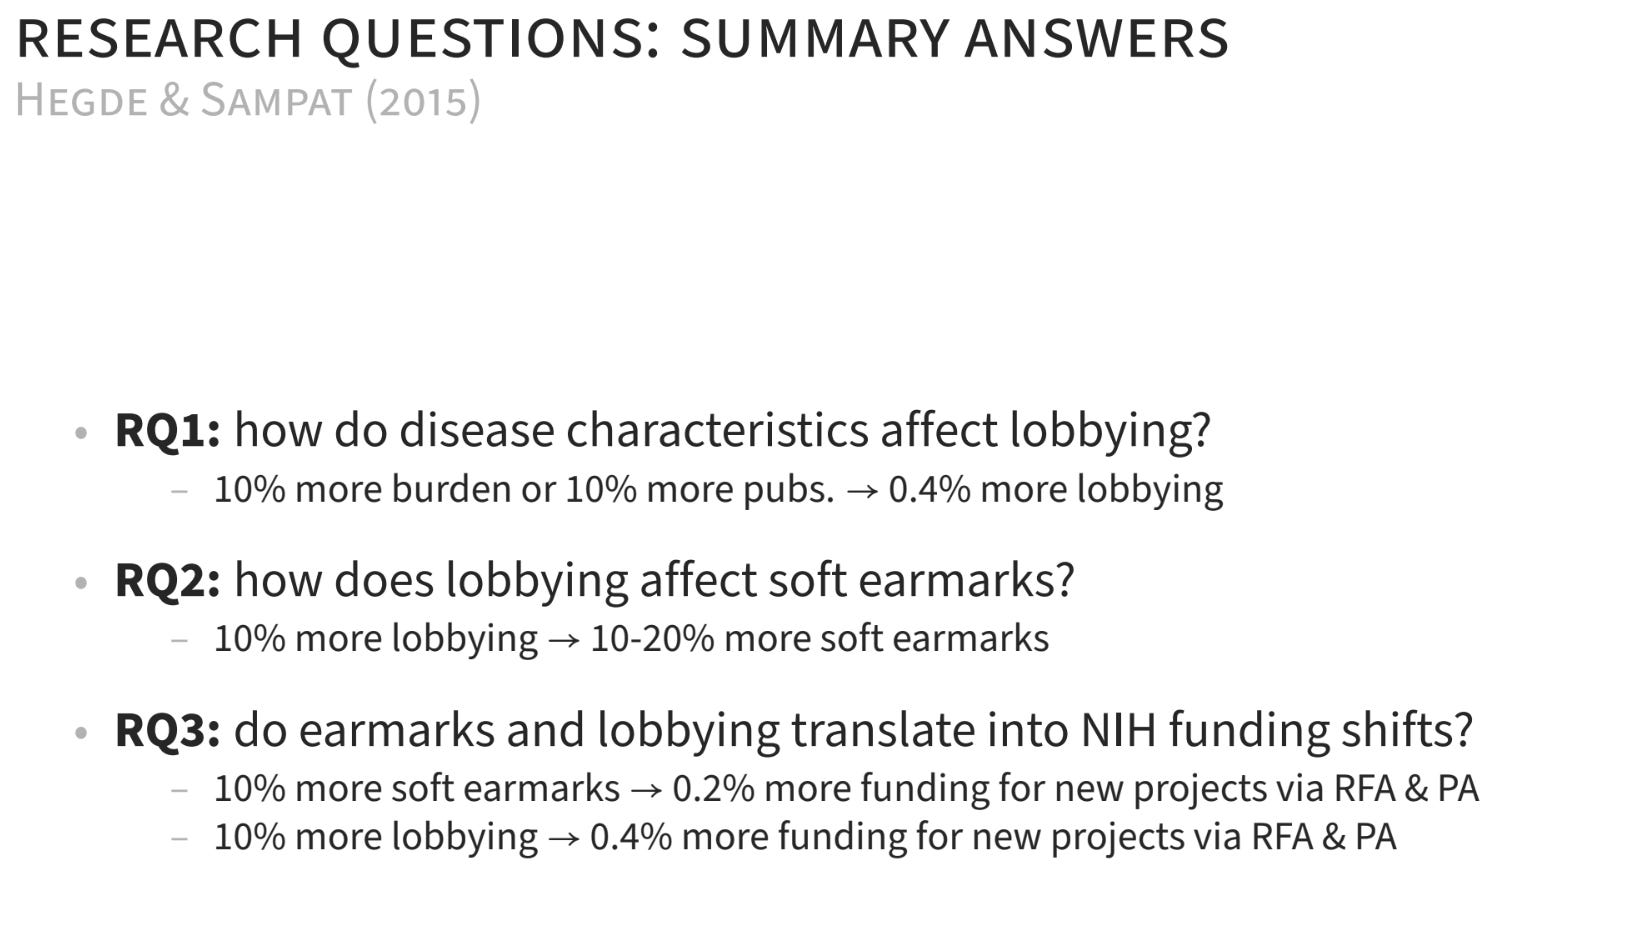
I’ve reported the coefficients here. These are all logs, so you can roughly interpret them as elasticities. They’re small but non-trivial. That 0.05 means that for a 10% increase in disease burden, there’s a 0.5% increase in lobbying spending. So there is more lobbying spending when these things go up, but there’s plenty of variation due to the residual there as well.
The next question is: how do all of our three states of the world and lobbying affect the rate at which we’re seeing these soft earmarks?
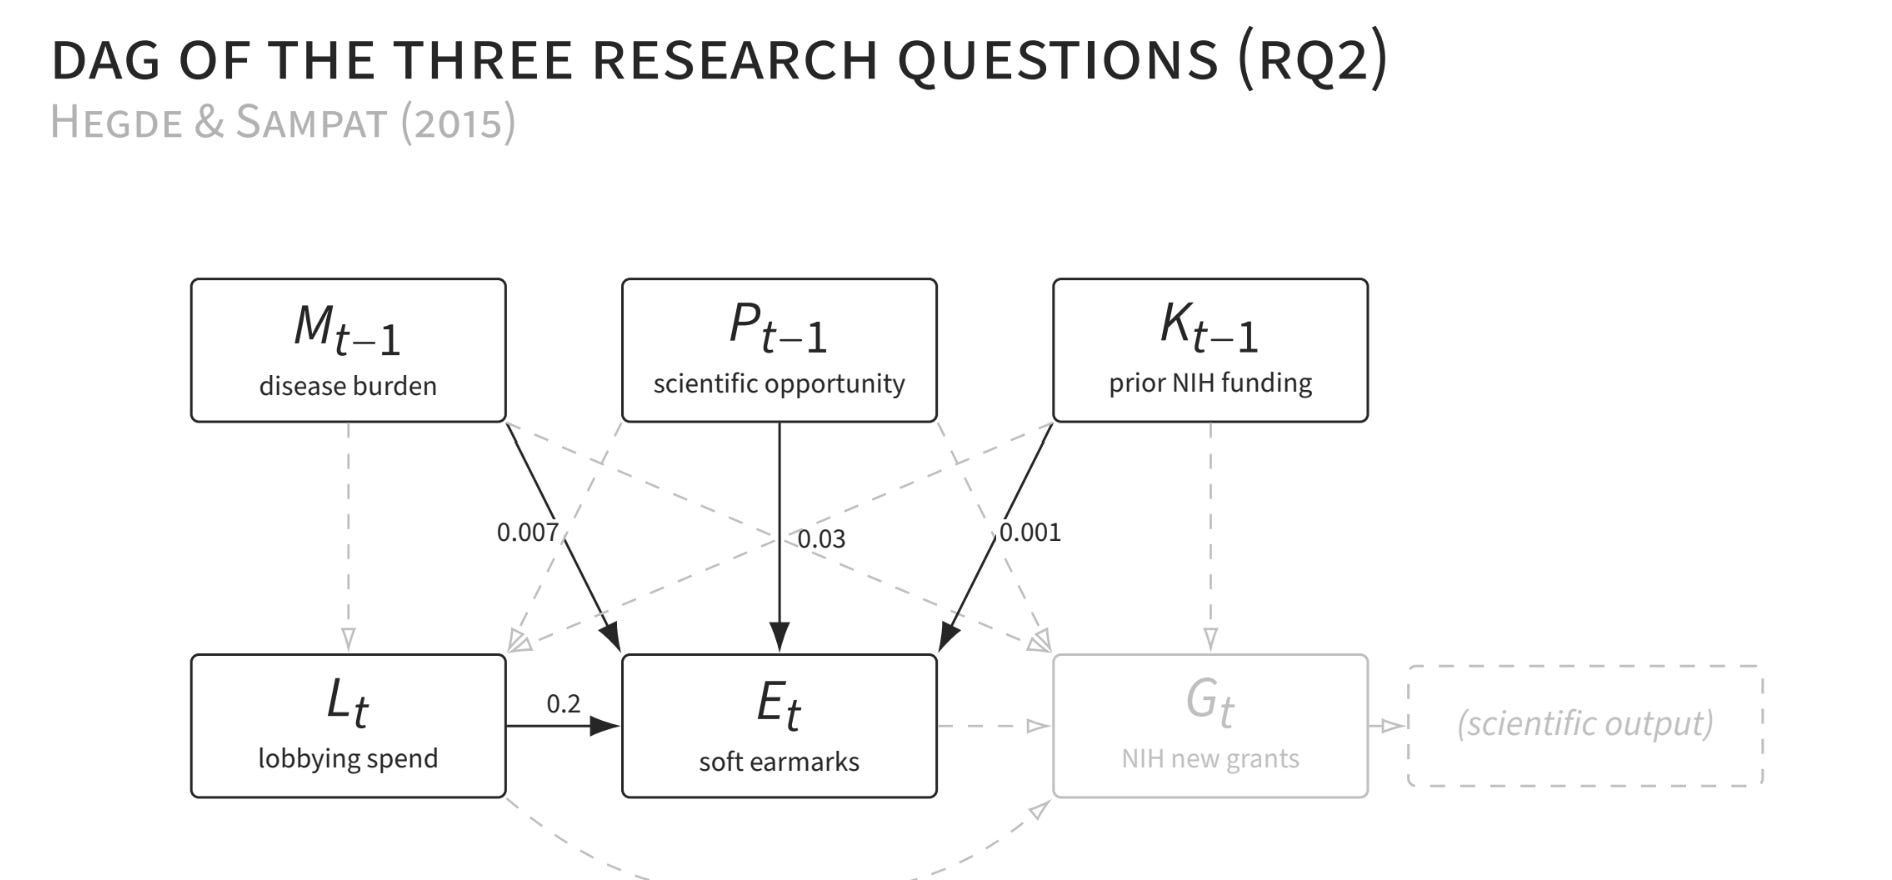
You can see there is some direct effect from disease opportunity and prior funding. Prior funding is effectively zero. There’s a clear effect from lobbying. I did my best to convert the estimate into an elasticity. It’s usually on the scale of 0.1 or 0.2, depending on the numbers you use from their data. That means for a 10% increase in lobbying, there’s a 2% increase in the count of these soft earmarks in the NIH.
They’re soft. They don’t legally require the NIH to do anything, but it doesn’t take a savvy political scientist to understand how this might influence the NIH. The third and most interesting stage in the paper is thinking about how soft earmarks then themselves affect grants.
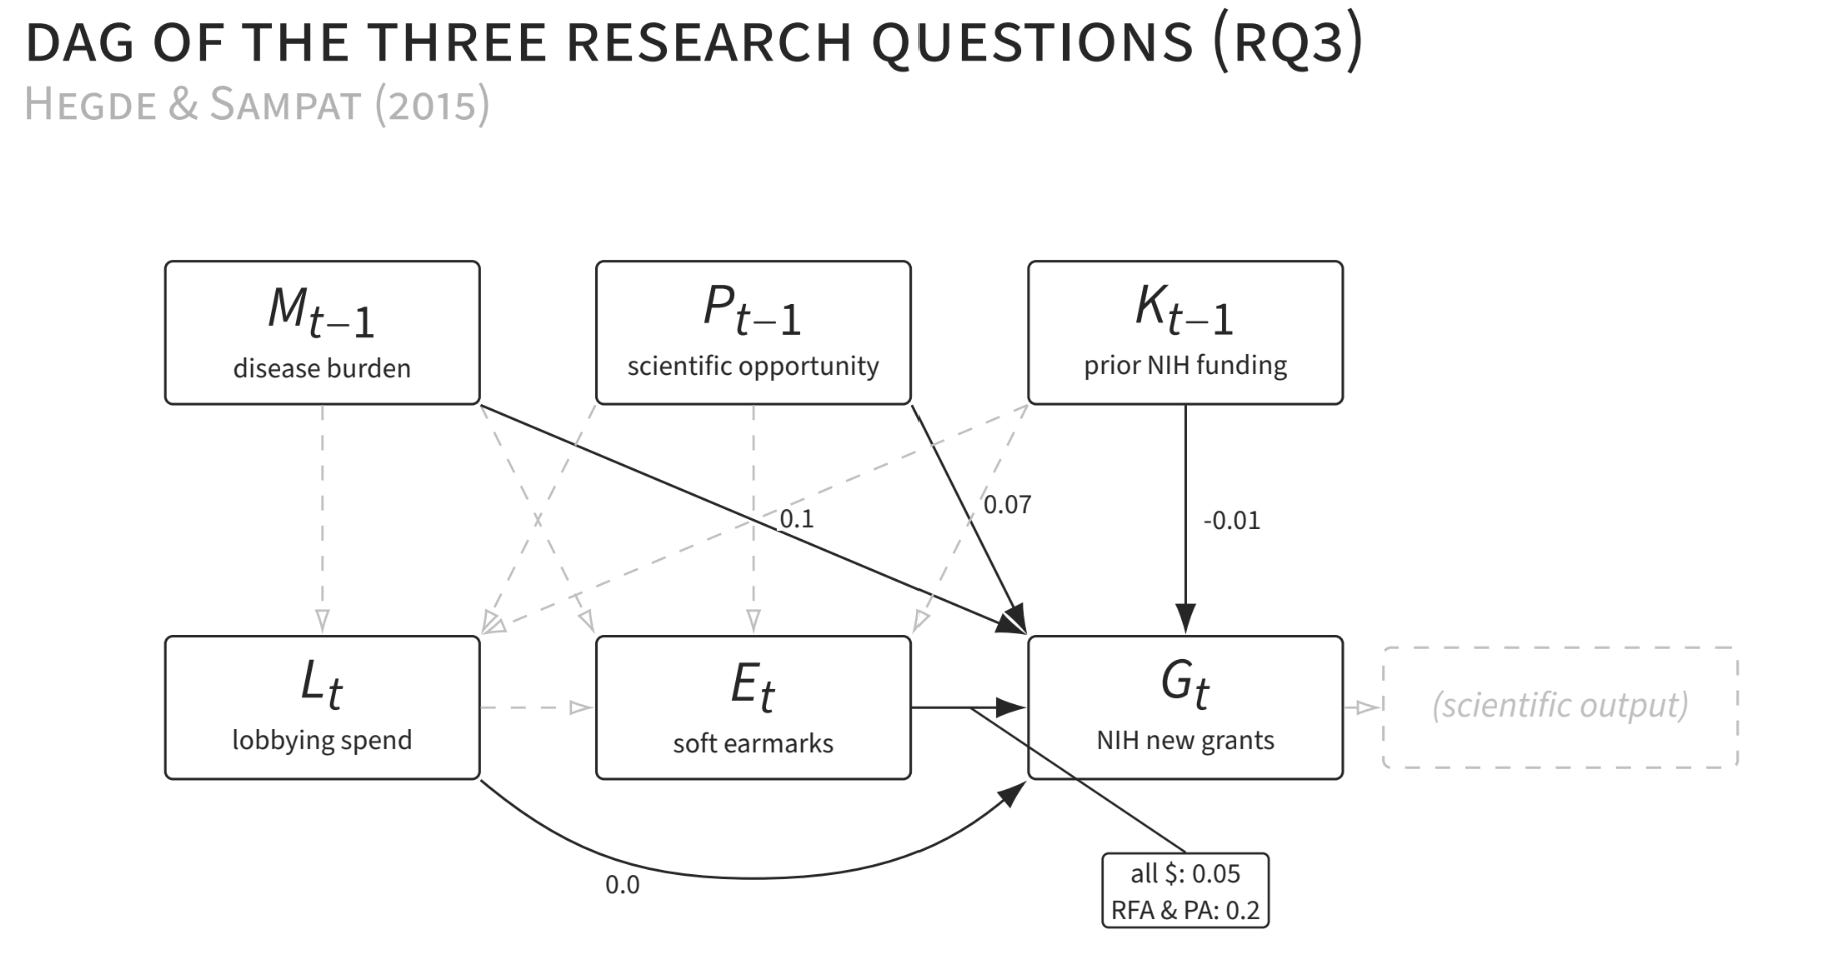
A fun thing I’ve shown with the zero on the bottom is that once you condition on soft earmarks, lobbying has no effect on the amount of money going to a particular disease. I wouldn’t call that a state-of-the-art approach for a mediation analysis given modern techniques, but it’s a good first-blush look at saying, “If lobbying does anything, it certainly looks like it does it via soft earmarks.”
The first interesting number there is the 0.05 on the all-dollars, which says that the soft earmarks have some pretty small bite on all of the funding. But if you zoom in on these requests for applications and program announcements — which is when the NIH itself sets aside some money for research on a particular topic — you see a much larger effect of the soft earmarks on the money going through those stores.
The most interesting question here is how this affects science. Unfortunately, I have to leave that in my little dashed gray box, because we don’t really know. I’ve summarized the questions here.
One of my favorite things this table does is break down their analysis into a bit of a decomposition, so that in normal English we can understand just how much the political lobbying going on for disease advocacy is influencing the NIH budget.
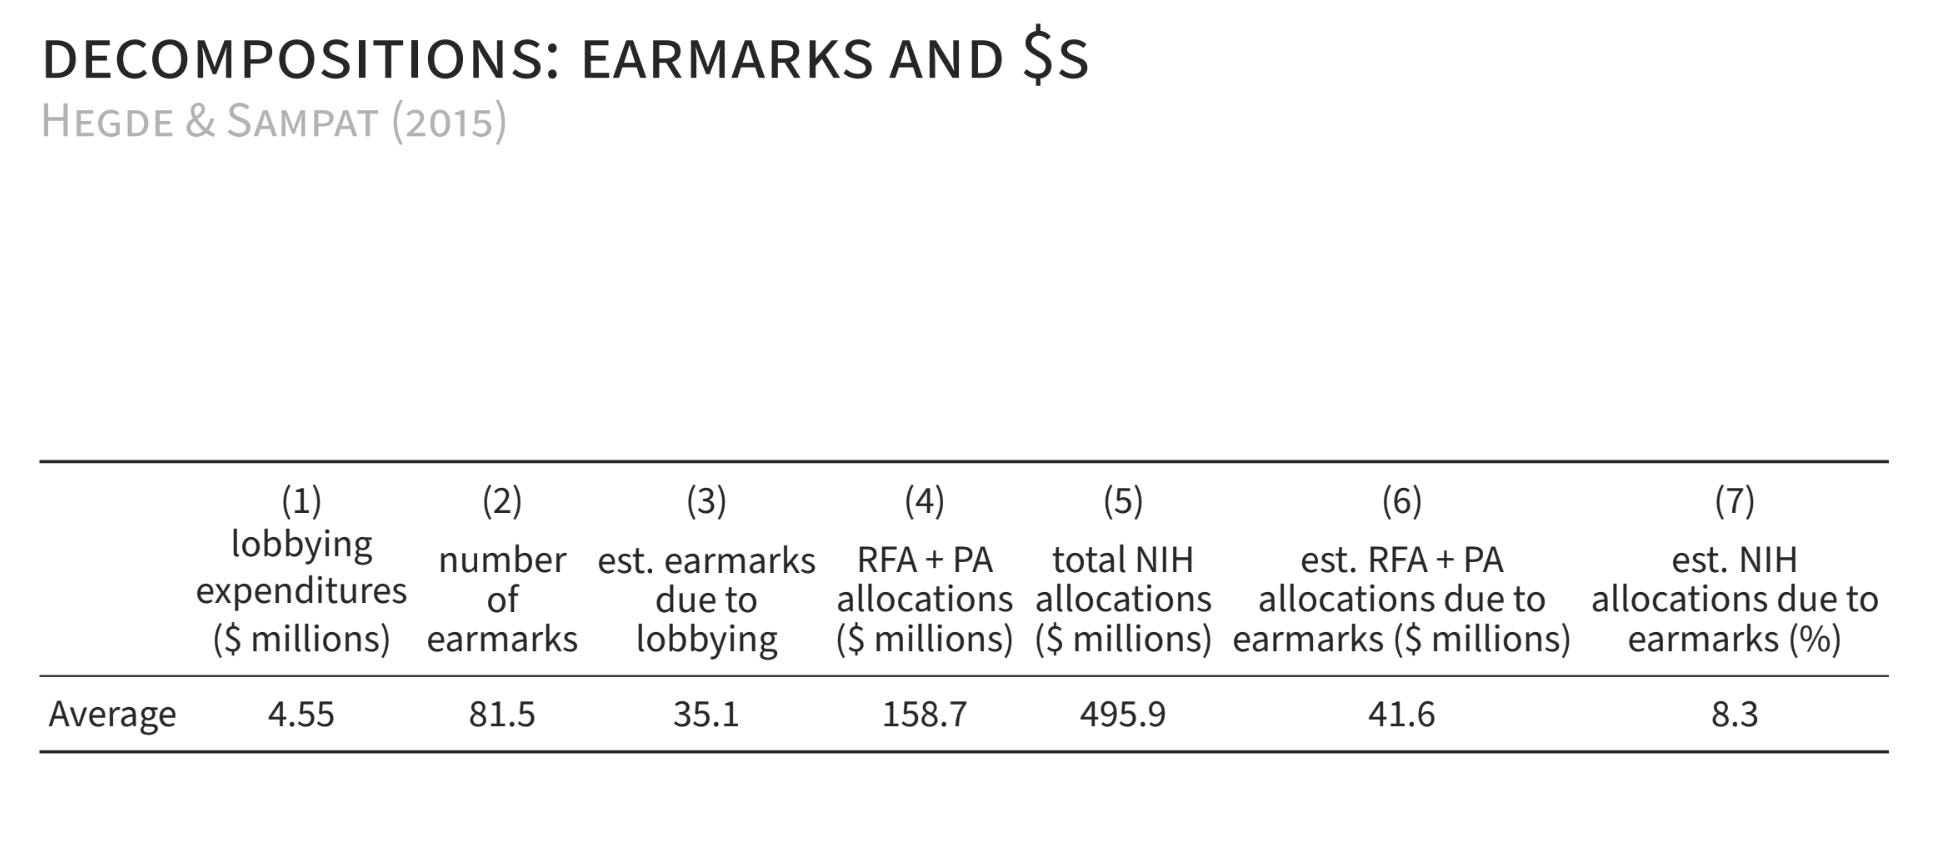
They break out the chain of events: the average amount of lobbying, how many earmarks there are in total, how many we think are due to lobbying, the total amount of money going out the door, and how much of that we think is due to the earmarks. We come up with an important number to have in our heads, which is that about 8% of the NIH allocations are due to these earmarks, with about 40% of the earmarks appearing to be due to lobbying. This is a great number to know, because my prior before reading this is that you could talk yourself into a lot of different numbers. This is a really good first step in understanding what’s going on.
A global public good
Another related paper I really enjoyed by Margaret Kyle, David Ridley, and Su Zhang, Strategic Interaction Among Governments in the Provision of a Global Public Good. It’s related to the findings we just saw with the Hegde–Sampat paper. I’m just going to read you the abstract, because it’s also a wonderful exercise in a well-written abstract that tells you everything you need to know:
“How do governments respond to other governments when providing a global public good? Using data from 2007-2014 on medical research funding, we examine how governments and foundations in 41 countries outside the US respond to funding changes by the US government.”
The idea here is, what does Panama do when the US increases its spending on malaria-related research? Getting to the identification challenge, they have a pretty nice approach where they do something similar to the Hegde–Sampat: they say, because funding is positively correlated with things we can’t see, we’re going to use the representation of research-intensive universities on congressional committees as an instrument. The idea being, if a senator from Wisconsin gets onto the Health and Human Services committee, and Wisconsin has a lot of people that want to study malaria, and we get more money into malaria research in the US, it’s only because that senator rotated on, and not because malaria science became more powerful, or the demand for malaria science grew.
They have a wonderful elasticity in the abstract that’s good to know, which is that for every 10% the US spends on a disease, there’s a 2-3% reduction by the other governments. This is a classic substitution — you see versions of this in many different sectors outside of science, but it’s very important. Science is a global public good. This is a challenge of managing the direction of science: lots of other countries will benefit from their spillovers. “The US government is double-funding something” — that might be a pessimistic take. An optimistic take might be, “In the long run, we’re attracting talent to our country, so the returns to scale are actually increasing.” There are lots of interesting debates around that. But at least in terms of the short run, this is a very important paper.
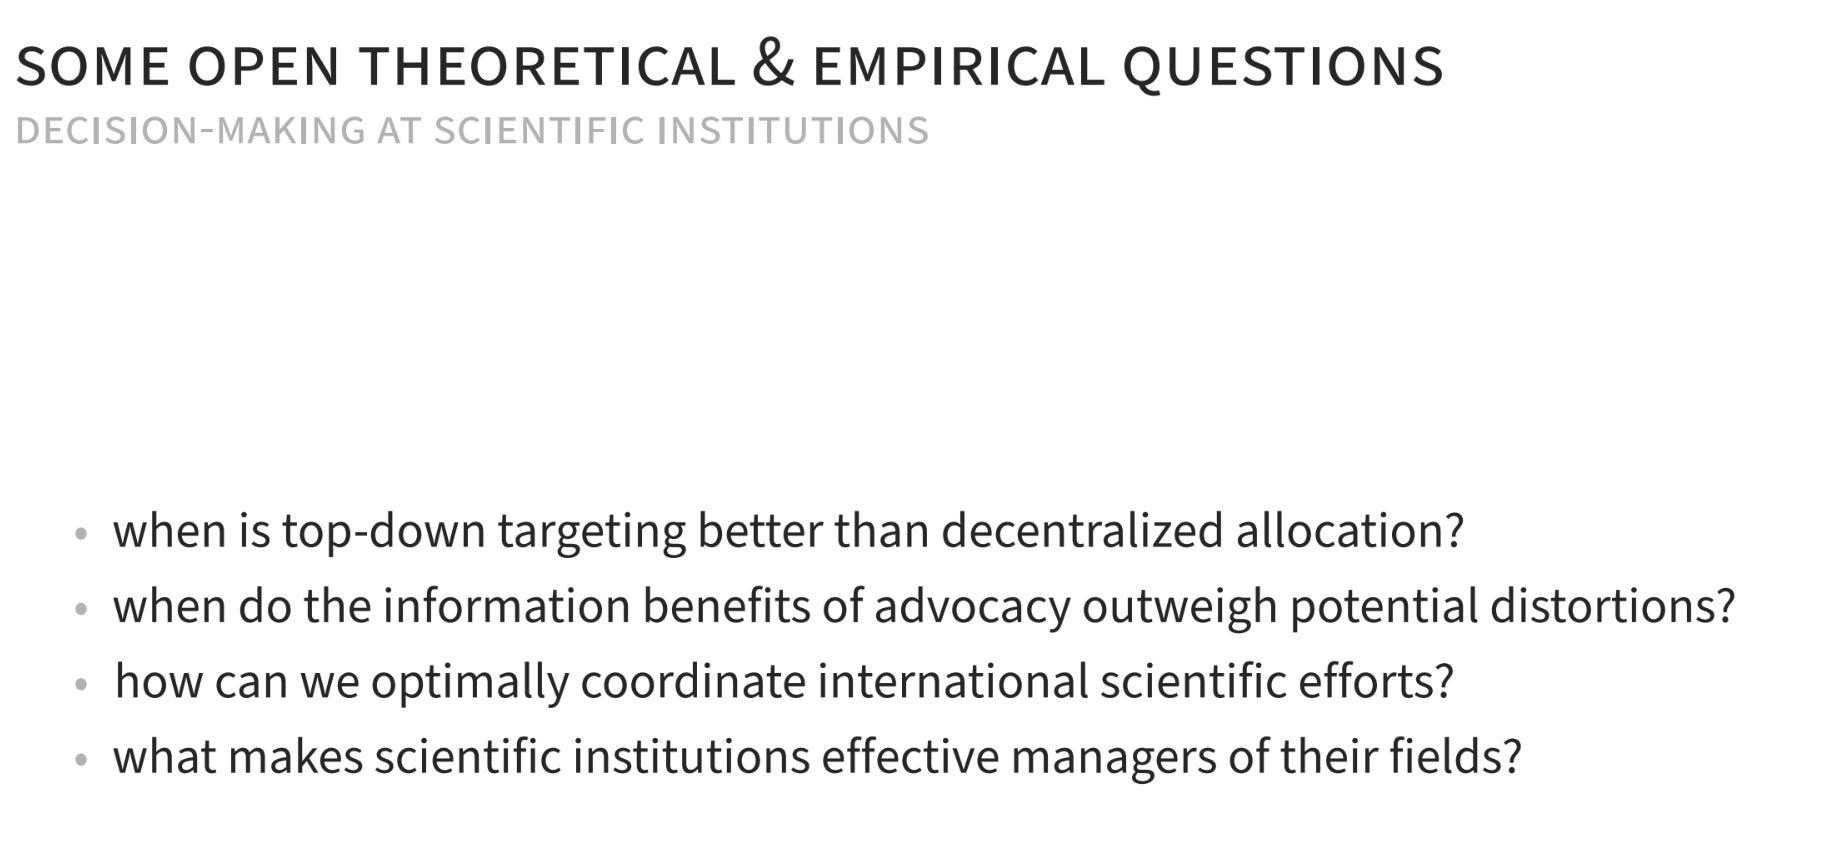
More generally, because of the challenge of studying how the resources get determined, there are a lot of very interesting open theoretical and empirical questions about how these decisions are made at institutions like the NIH or the NSF, where I think there could be lots more work to be done.
Which scientists do we fund?
For the rest of this, we’re going to be working through the lens of, “Let’s all assume we’ve agreed we’ve got to spend $10 billion on cancer research. Which scientists do we fund? How do we give them the money?” All of those kinds of questions.
Before we get into grants specifically, another terrific review paper is by Pierre Azoulay and Danielle Li, Scientific Grant Funding. It starts with a step backwards in the chain of thought and says, “When and why might one want to use grants?” which is the bread and butter of what you see many public scientific institutions using, “As opposed to the three other mechanisms you might consider when trying to incentivize innovation.” They have this very nice little diagram that helps you think about when these different mechanisms are optimal in theory.
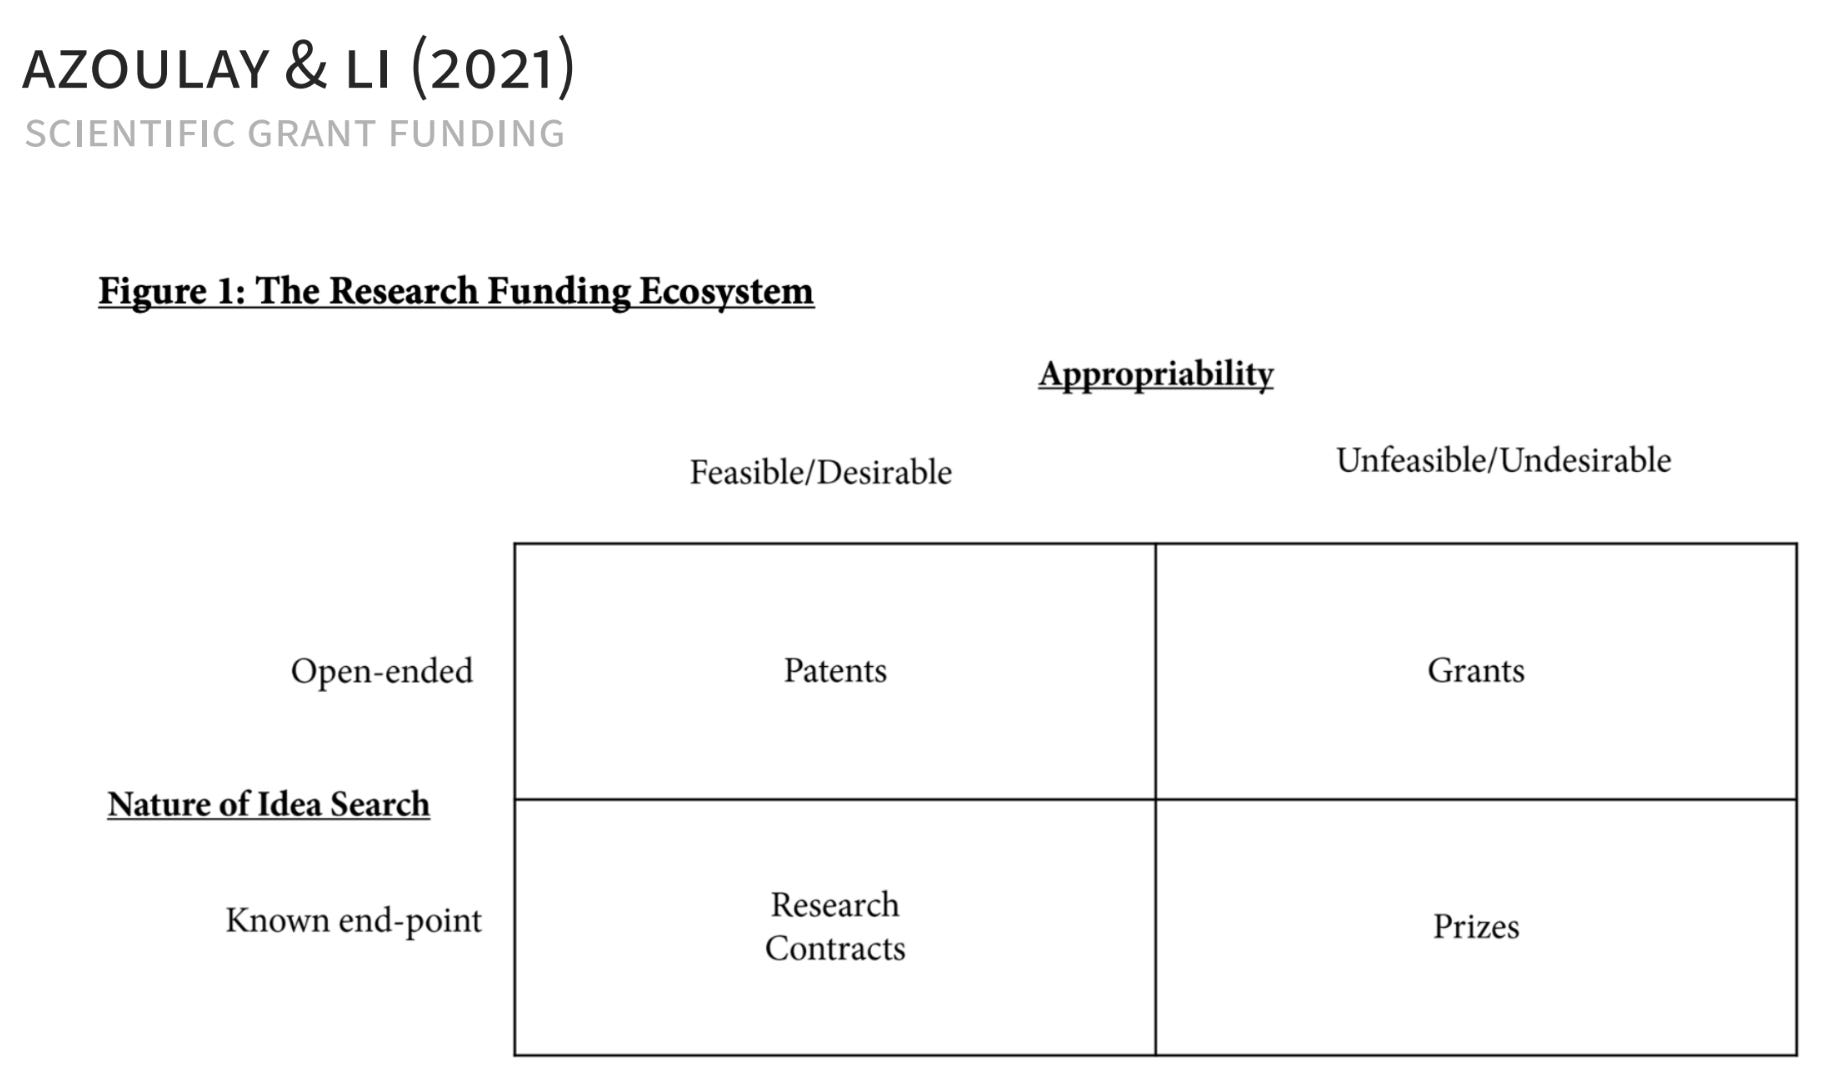
Grants are great when the question in question is very open-ended and hard to describe, in terms of the nature of idea search and in terms of appropriability. By appropriability, we mean, if the scientist is going to create $100 of value in the world with their discovery, how much of that value will they capture in some way? There are certain ideas whereby, just by the nature of that idea, the scientist will never be able to capture much of that $100 at all. That leads you to a world of grants, where you’re going to give the money up front and say, “Please do something nice for the world.” That please will have a lot of restrictions and rules and regulations around it, but that’s the world that gets you into grants.
We’ll come back to grants in a little bit. I thought it would be worthwhile working through the other mechanisms as well and giving some examples of what they look like, because in a full portfolio of managing the direction of innovation, these other things are very important. The wall of cites is me just trying to put some stuff there so you can see a few references to pursue if any of these mechanisms look interesting to you.
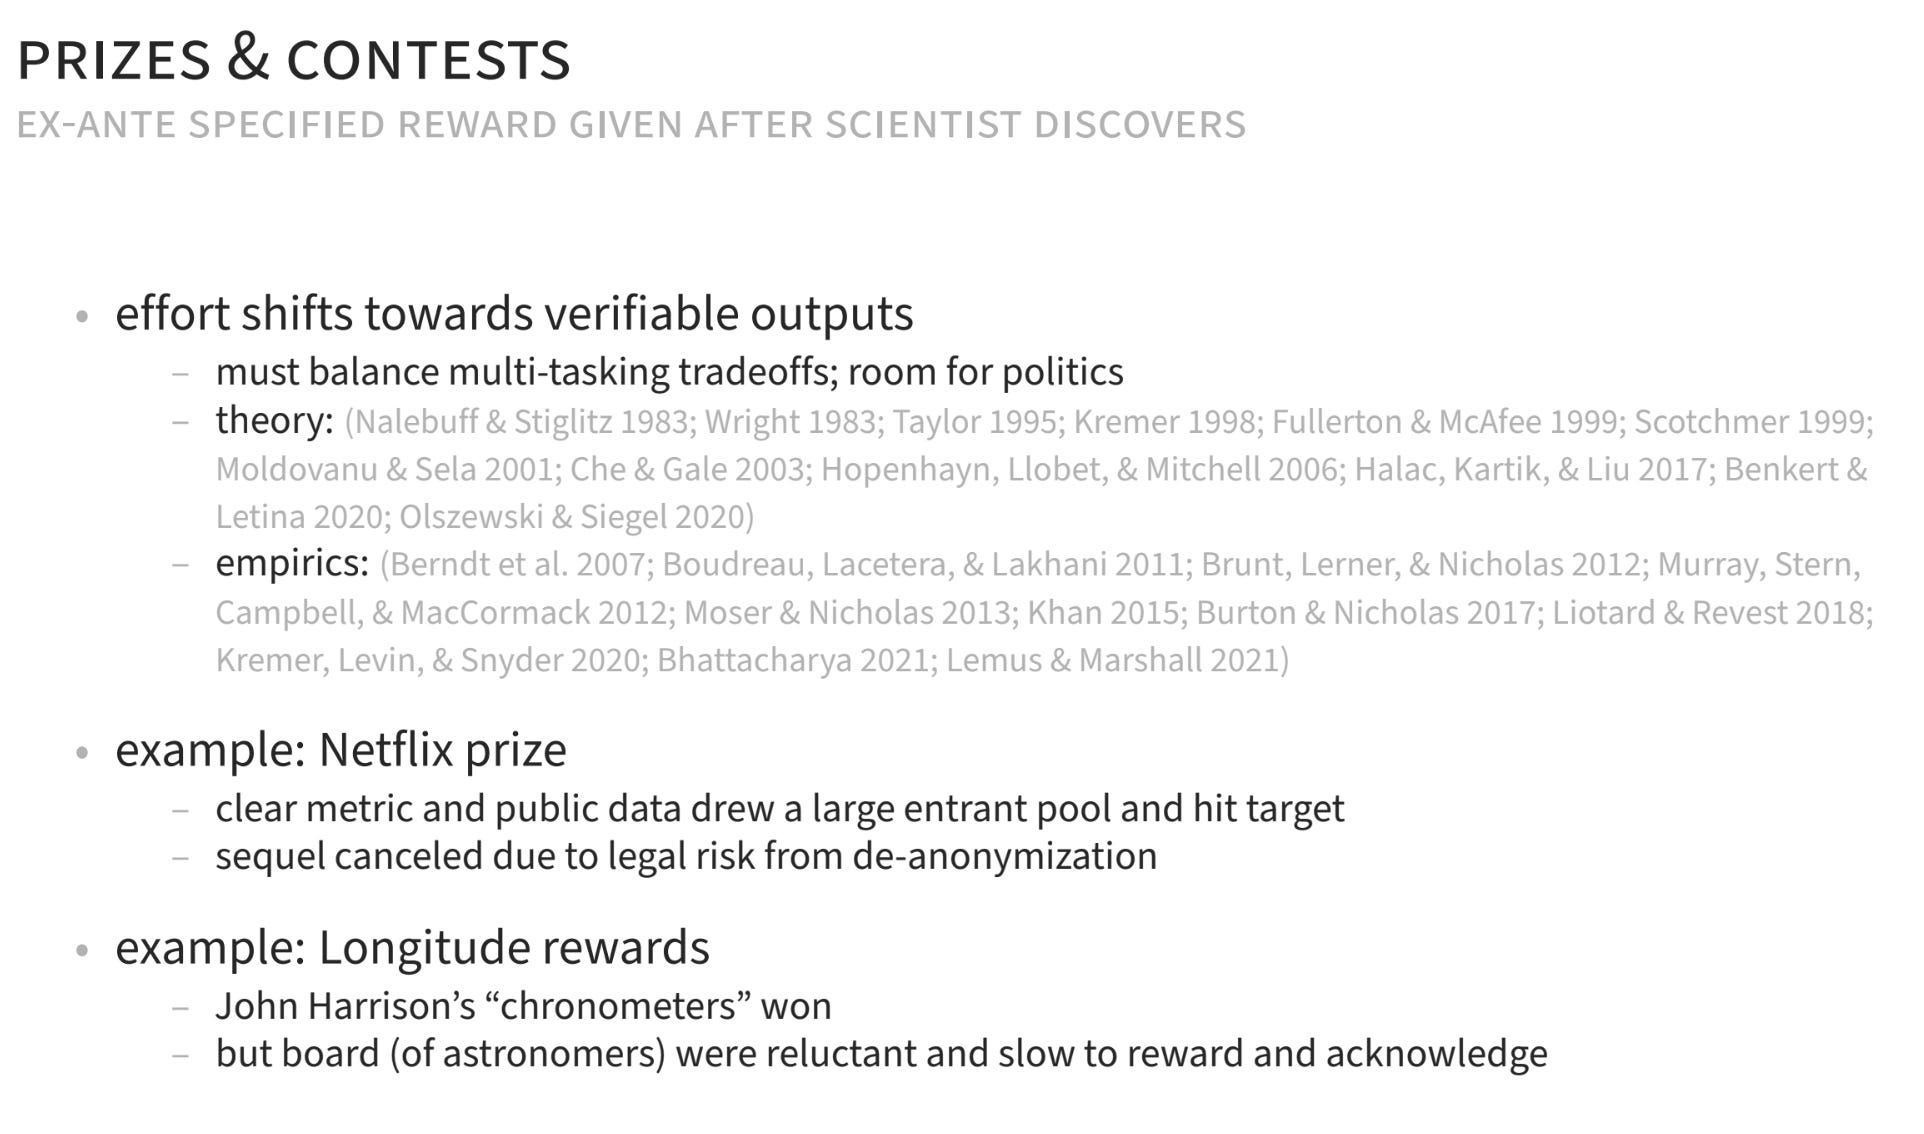
Prizes and contests
Prizes or contests are where we’re going to, ex-ante, specify a reward that we’ll give to somebody if they achieve a certain outcome. This obviously requires the output to be verifiable. The challenge here is going to be classic multitasking trade-offs to be balanced, which is, you better be sure you are incentivizing task A to get people to do A, because if you say we’re going to pay for A, but everybody can only actually do B, or you actually want B, you’re going to get A and not B. It turns out, when you think about frontier science and new ideas, the whole idea is you don’t know the solution to the question, so it’s very hard to ex-ante write down a description of something that can be verified ex post.
Where does this work? You see this in things like the Netflix Prize. This is a verifiable thing, where Netflix said, “We want to improve the mean squared error,” or whatever fit metric they had, “of our algorithm. Here’s all of our data. Let’s see if someone can come up with a better algorithm.” That’s verifiable, because you just submit your algorithm, run it on a benchmark set of data, and there’s no debate as to who wins the prize.
One interesting thing, which I’m always a bit cautious to talk too much about as an economist and not a political scientist, is that these ex-post rewards open the room for broadly construed politics, or risks of things that are a little bit harder to handle. In the Netflix case, when they tried to run it again, they wanted to publicly release the data, but it turns out there was some concern that the data they had released would actually allow the public to de-anonymize and identify individuals.
Another great example people often use is the famous longitude rewards, as an example of a successful prize in science. They were both successful and a good example of what can go wrong with prizes. John Harrison was a watchmaker in England, and he was the wacko who thought he could measure longitude just with clocks. The board of the longitude prize was mostly comprised of astronomers, who all assumed that, “Whoever wins this is going to come up with some new fancy way of using the stars to figure out longitude,” which would be a variant of how sailors had been navigating up until that time. So John starts sending in his chronometers that are crushing the competition when it comes to measuring longitude, and the board of astronomers kept moving the goalpost, asking more of him, and delaying his payments. It’s something like 80 years after his first chronometer was submitted that he actually got his final payment. That difficulty in committing to the payment is another political concern of using things like prizes.
Research contracts
Research contracts are kind of like a prize, but it’s a prize on the input side, which is saying, “If you put a certain amount of inputs in a certain direction, regardless of what happens, we will pay you for it.”
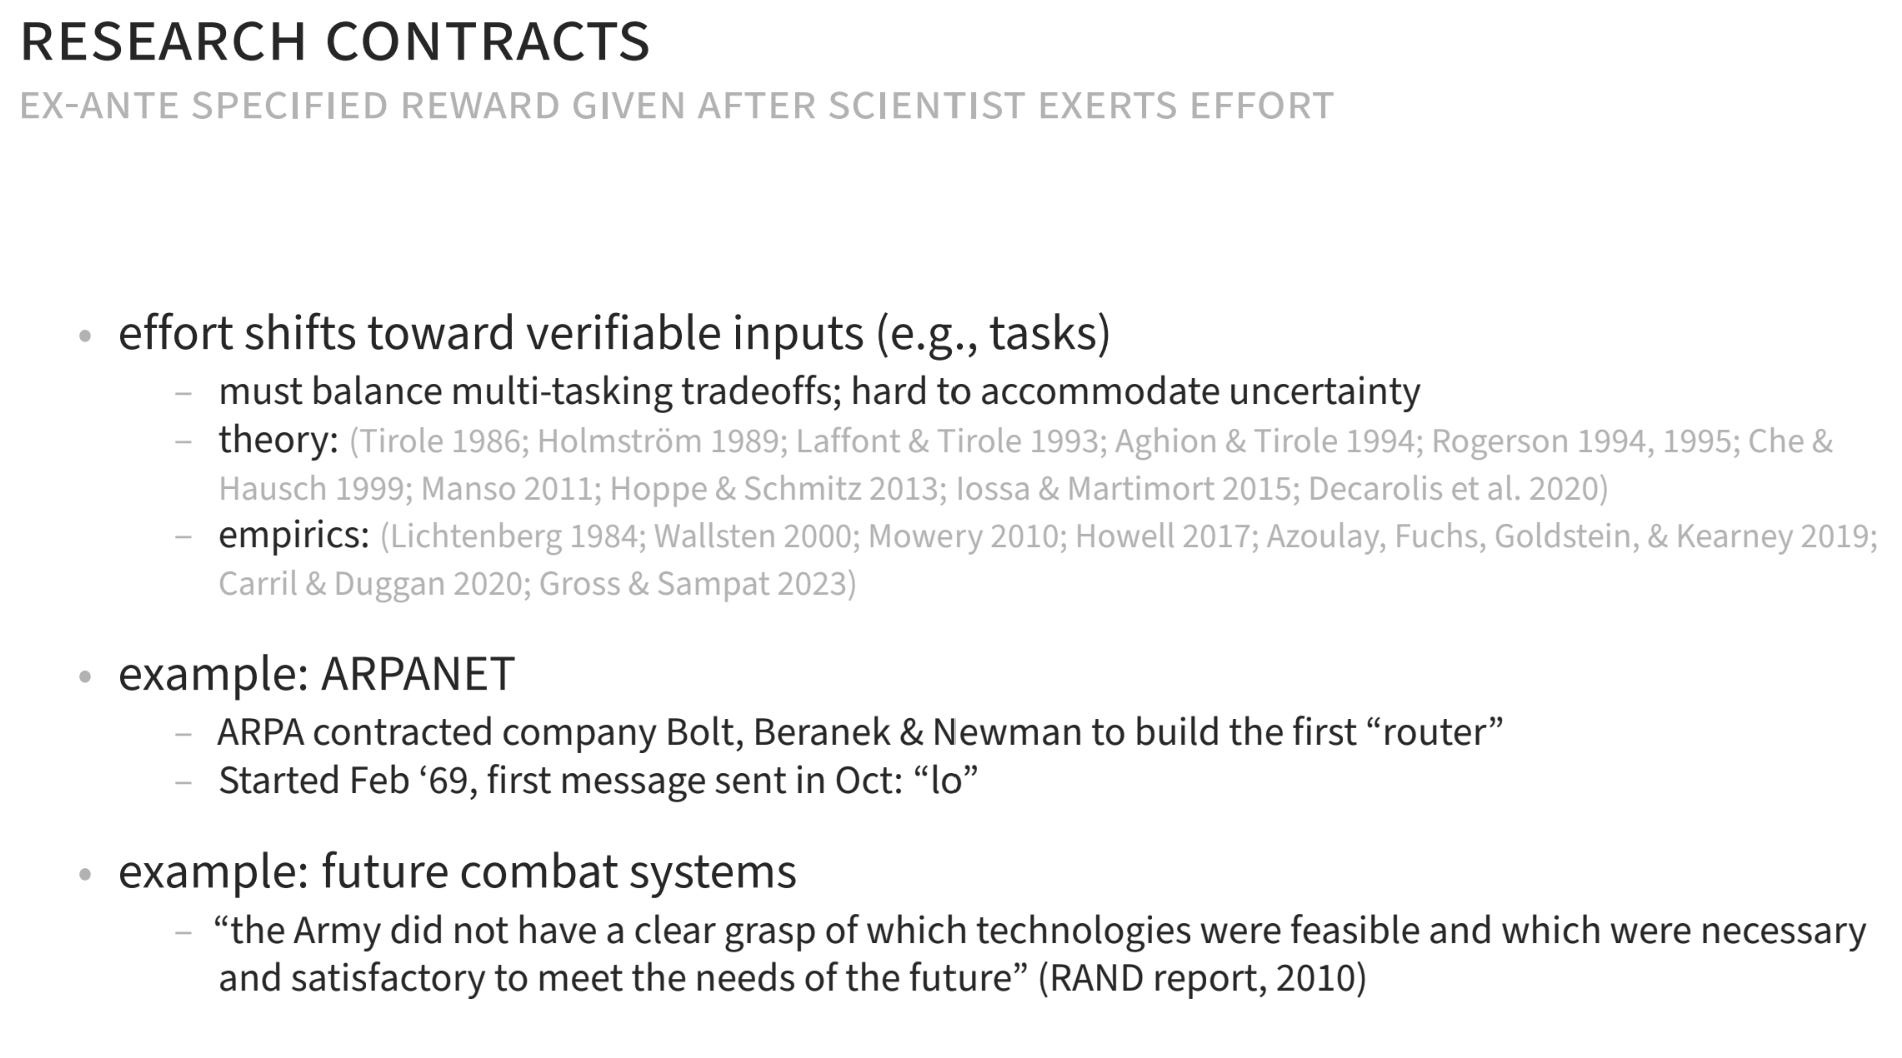
You have the same multitasking trade-offs; they’re just realized at the input stage. The challenge here is that you have to be very clear about the inputs. We have to have verifiable inputs, and the person using this mechanism has to know exactly what needs to be done.
A good example of this is ARPANET, the origins of the internet. After ARPA had the idea of how they were going to try to build the first internet, they needed to make these things. They’re called IMPs, but it’s basically a router — the machine that would stand in between two computers to send the signal back and forth. They had enough sense of how it should be done, but not quite the resources. So they developed a research contract with the company Bolt, Beranek and Newman, who’s now part of Raytheon and is a legendary company within the history of the internet. Fun fact I learned developing the slides: the first message they sent was “LO,” because they were trying to send “login,” but three letters crashed the system, so they had to do a few hours of recoding to get it to work again.
An example of leaning into research contracts when a little too early was in the 2000s. The Department of Defense, specifically within the Army, had a very big push which they called Future Combat Systems. As this quote from a RAND report afterwards indicates, they might have embraced this mechanism before they had a clear understanding of what was technologically possible. Writing contracts over things you don’t understand, unsurprisingly, can have some downsides.
Intellectual property
Last up before we get to grants is intellectual property rights writ large.
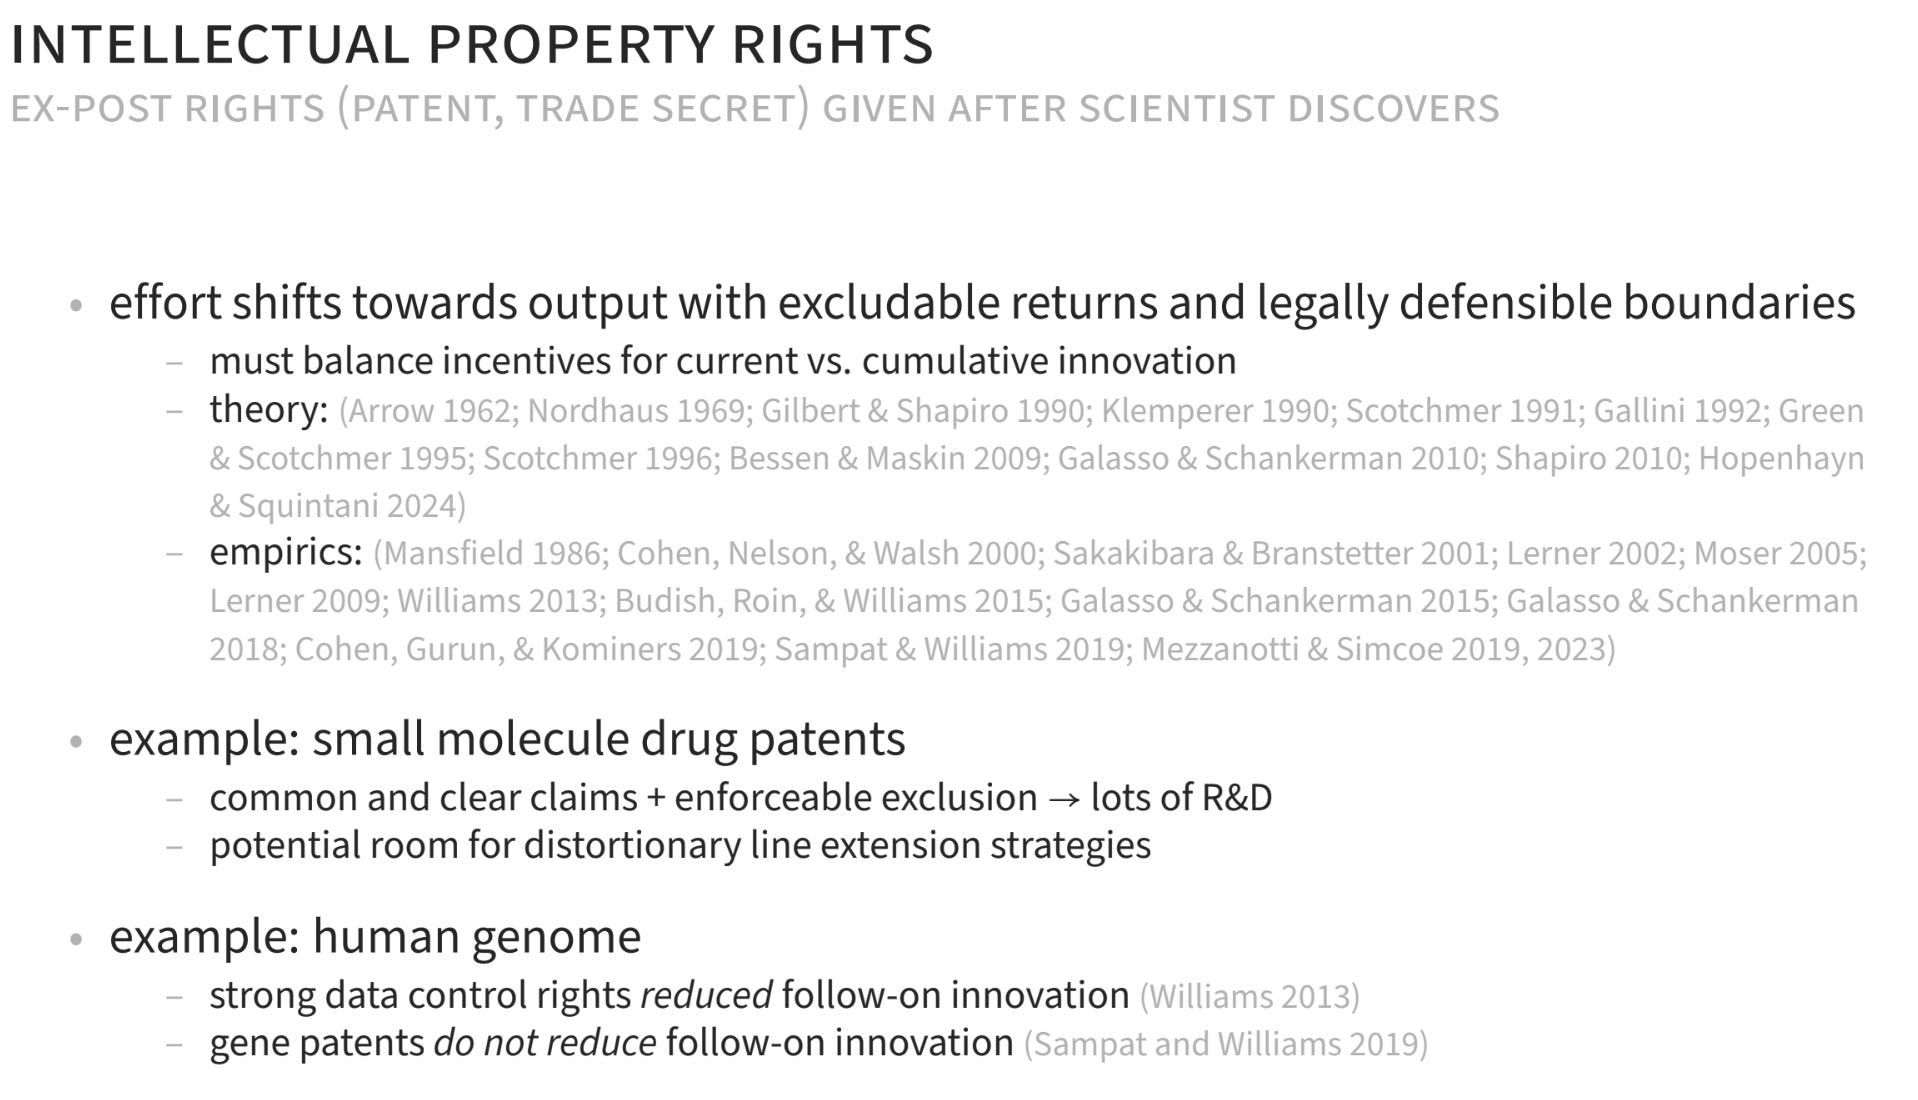
You’re probably thinking of patents as the default thing to think about here, but when we’re talking about IP in general, it really is just: someone has ownership over the idea and can do with it whatever they want, including selling rights to use that idea. These are really interesting things, in the sense that it’s going to direct people’s output — they’re going to shift their effort towards things that are well defined and have legally defensible boundaries, whether it’s via trade secrets, contractual licensing, or patent licensing.
The big challenge here is balancing static and dynamic trade-offs. The static positive incentive is clear. If I know that when I invent the next magical drug, anyone who wants to use it has to pay me, that’s a very large incentive for me to go after high-market things. The downside is that if I invent something that is very important for a lot of other people to invent other things, then there might be a dynamic friction whereby I would extract so much rents from other people who want to use my new invention for their new inventions that it would actually be suboptimal to give me full property rights over that idea. Balancing the current incentives for innovation versus the dynamic incentives for cumulative innovations is at the core of what a lot of these theories and empirics are getting at.
Grants
Now let’s start to get more into grants, which are the bread and butter for a lot of the frontier basic science where appropriability is very hard and the definition of ideas is very nebulous. The best we can do is going to involve a lot of frontloading of resources before anything verifiable comes out.
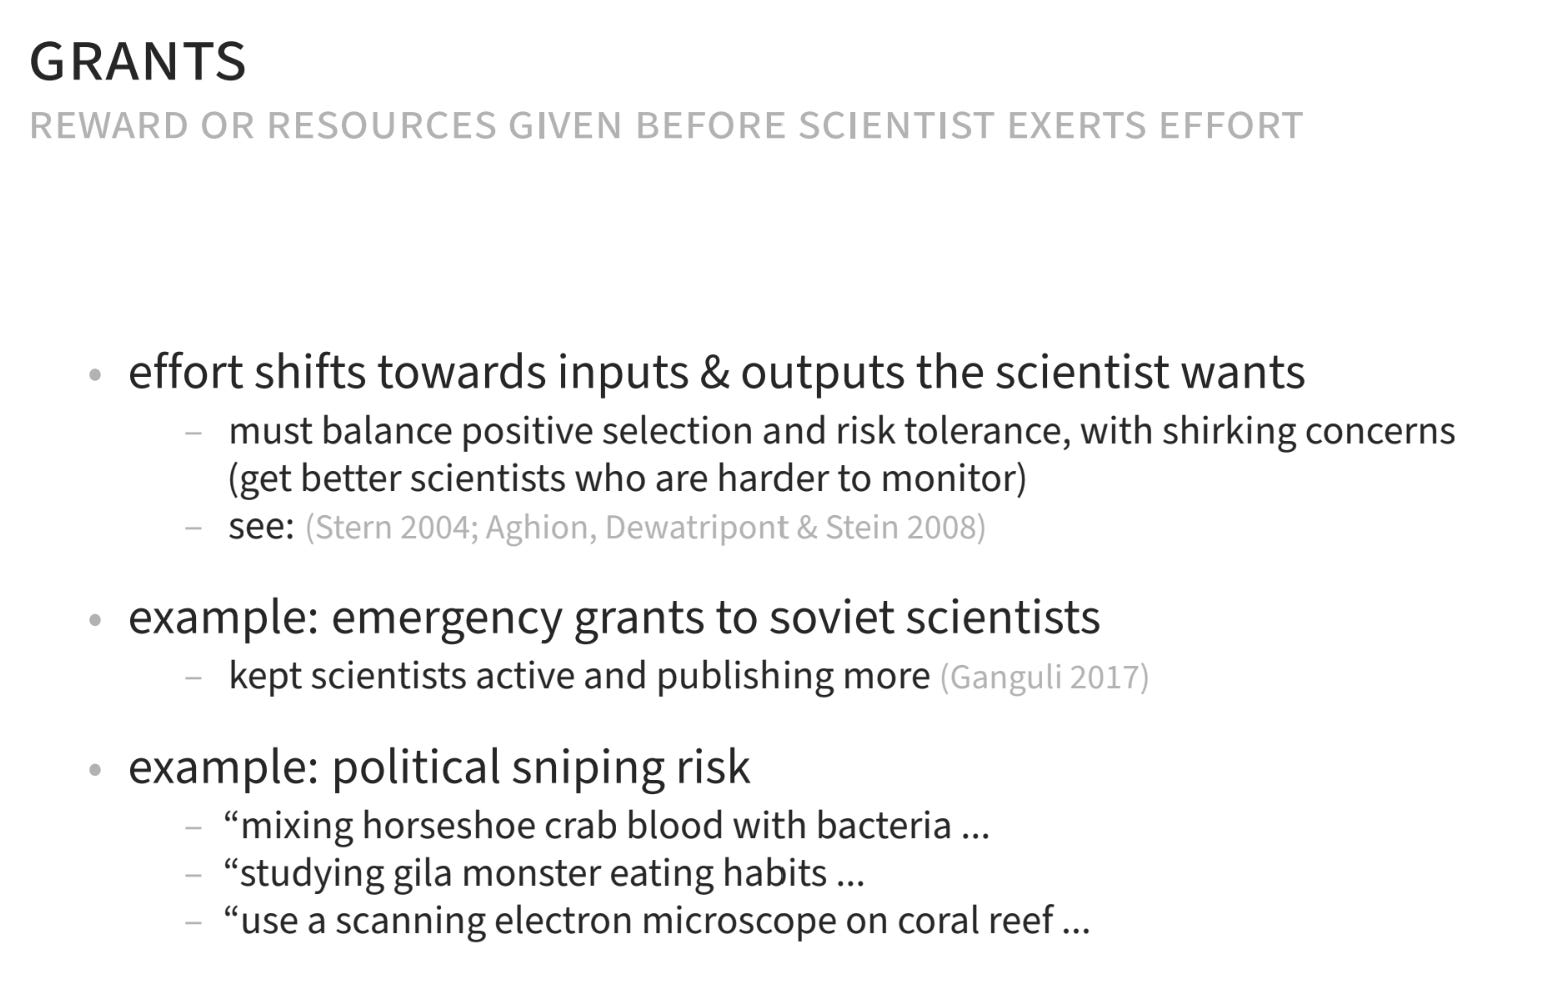
In terms of the trade-offs here, there’s good evidence from a lot of different papers that these things do work in practice. One of my favorite more dramatic examples is by my colleague Ina Ganguli. She has a wonderful paper, Saving Soviet Science: The Impact of Grants When Government R&D Funding Disappears, that showed how, during the fall of the Soviet Union, there was a push from George Soros to give a lot of money to Soviet scientists to try to help them continue doing work in science. She has access to the very simple algorithm that defined who got the money. There’s a very nice regression discontinuity for those of you who know what that means — a really good treatment-control setup. She shows that these grants, which were about a year’s worth of salary, were very influential in keeping scientists in the scientific profession and publishing during this time.
The downside here — another political-risk undercurrent — is that when you’re giving people money to do things when you don’t really know what’s going to happen, it’s easy to grab the title of these efforts and make it sound like wasteful spending. I have three examples here of things that, in different avenues, certain people would probably think is a poor use of our taxpayer dollars. All three of them are super important ex-post.
Horseshoe crab blood is now the key way we test anything we inject in humans for safety before it goes out the door. During the pandemic horseshoe crab blood was one of the things that got short very fast as we were trying to ramp up production of vaccines.
The GLP-1s that are taking the world by storm: one of the origins was researchers studying Gila monsters. It turns out Gila monsters don’t eat for a very long time, and the question was just, “How do they not eat for so long?” Ex-post you can see, “That’s going to prove useful for managing humans and their diet.” But in the moment, it’s the kind of thing that my four-year-old would just be like, “Let’s talk about Gila monsters and why they don’t eat so much.” It sounds a bit silly.
Another one is, “We’re going to use a very expensive scanning electron microscope on coral reef just to look at it.” It turns out we learn how to make better bone grafts. These sorts of stories are all over the place.
That’s not to say there’s not wasteful spending, which is something we’ll come back to at the end. If you’re interested in this sort of thing, the Golden Goose Award is a wonderful website where they give out fun awards to scientific projects that have this flavor of seemingly silly-sounding but ultimately very influential research.
The granting enterprise
Let’s get into the design of the granting enterprise. I can’t recommend enough this paper, Designing Scientific Grants, by Christoph Carnehl, Marco Ottaviani, and Justus Preusser. It’s a terrifically written review that gives you a really good overview of the state of the predominantly theoretical art when it comes to how economists are thinking about designing scientific grants. I’m going to move through this and talk about a few things they cover.
One thing they do a good job of emphasizing is that this is a multi-step process, and decisions made further down that process will ripple back up through.
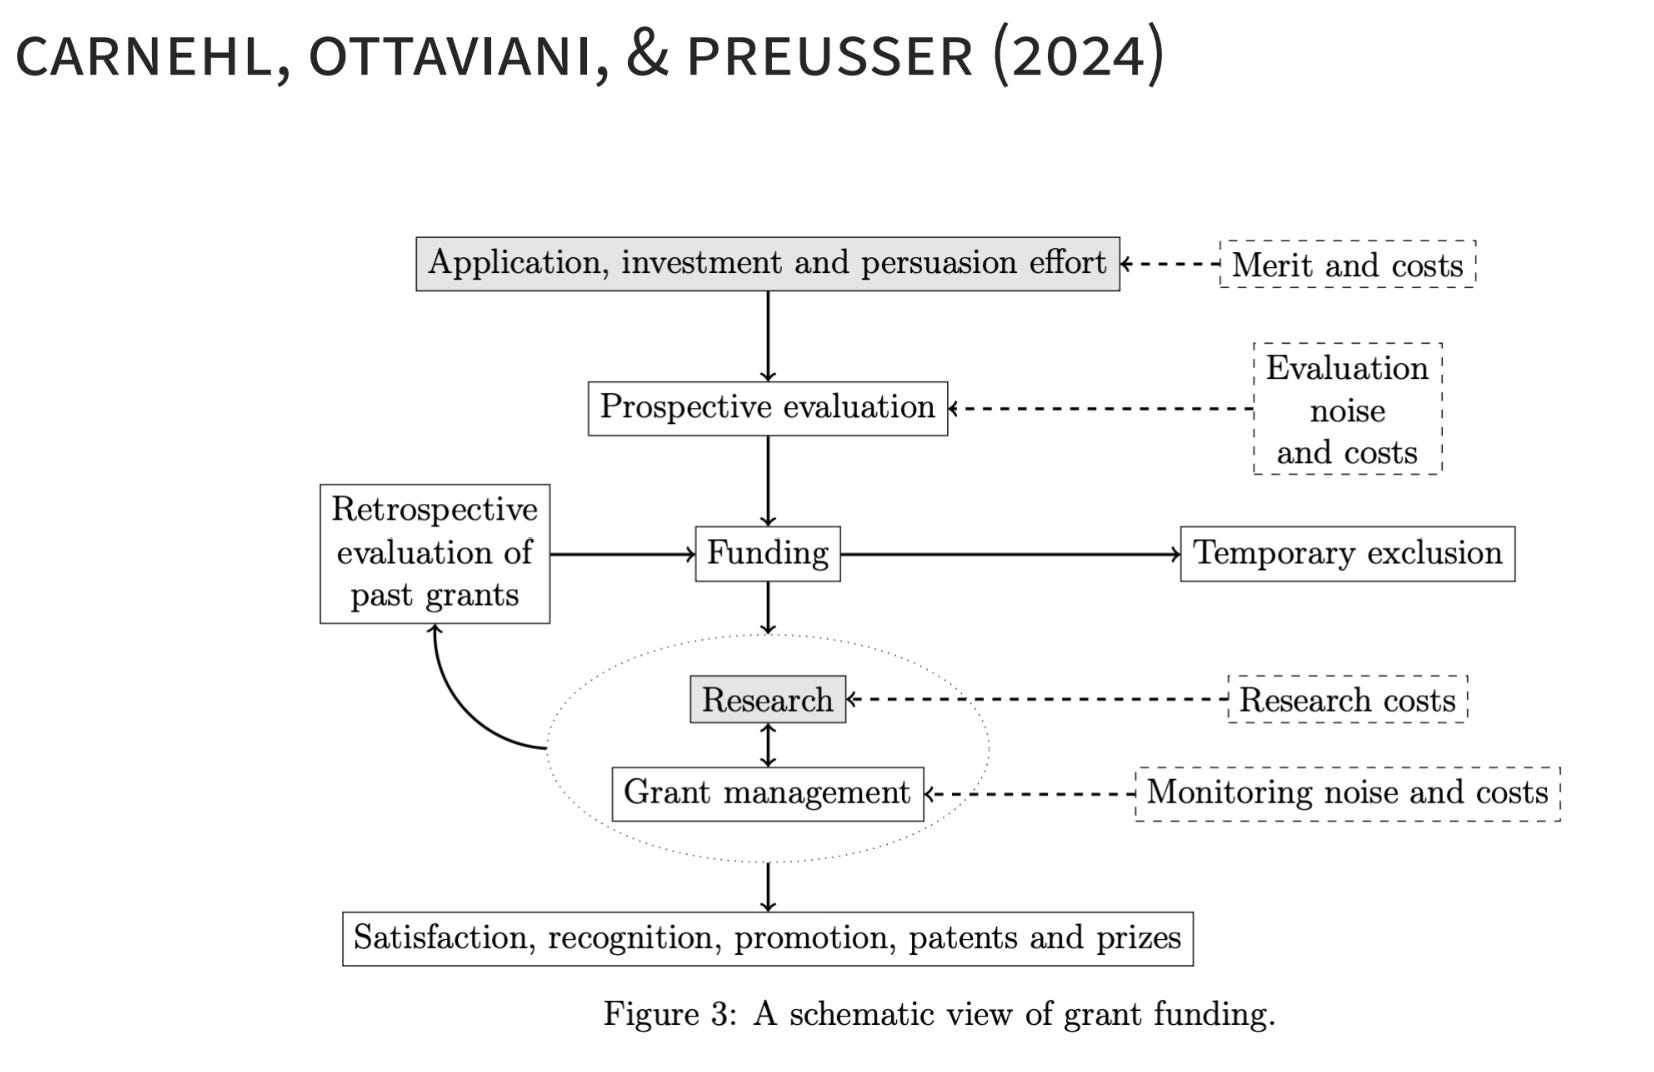
Seemingly trivial-sounding things, like “How long do we let people use the money in their grant?” can cascade backwards and ultimately influence the types of scientists who are applying for different types of grants. Keeping those dynamics in mind is very important.
They also have — partly because Marco is a co-author of both this terrific paper as well as the review — a really nice compressed-lesson version of this paper by Jérôme Adda and Marco Ottaviani, Grantmaking, Grading on a Curve, and the Paradox of Relative Evaluation in Nonmarkets. I’m going to walk through that now, because I think it’s really cool intuition. This and a couple of the other theoretical models I’m going to talk about are going to be slightly oversimplified in ways that are not the most technically correct version that’s in the paper, where you take everything very seriously. But it’s a good starting point, and not everybody needs to know the very difficult high-end details of how this theory works. The intuition delivers a lot of what’s important and can motivate a lot of interesting questions.
The first interesting thing is a fun result where perfect information actually leads a market to unravel. A classic result in economics is the paper by George Akerlof on the market for used cars. The idea being, in something that looks like a used-car market, if everybody is uncertain about the quality of vehicles, fewer people want to engage in that market, which means the only people that want to sell their used cars might have worse used cars, which means the people who might buy think everything is worse, which means everybody who sells only sells worse. That’s the kind of unraveling thought exercise that can happen in worlds where there’s imperfect information. This is going to push you to think about a world where unraveling can happen with perfect information.
The setup is very simple.
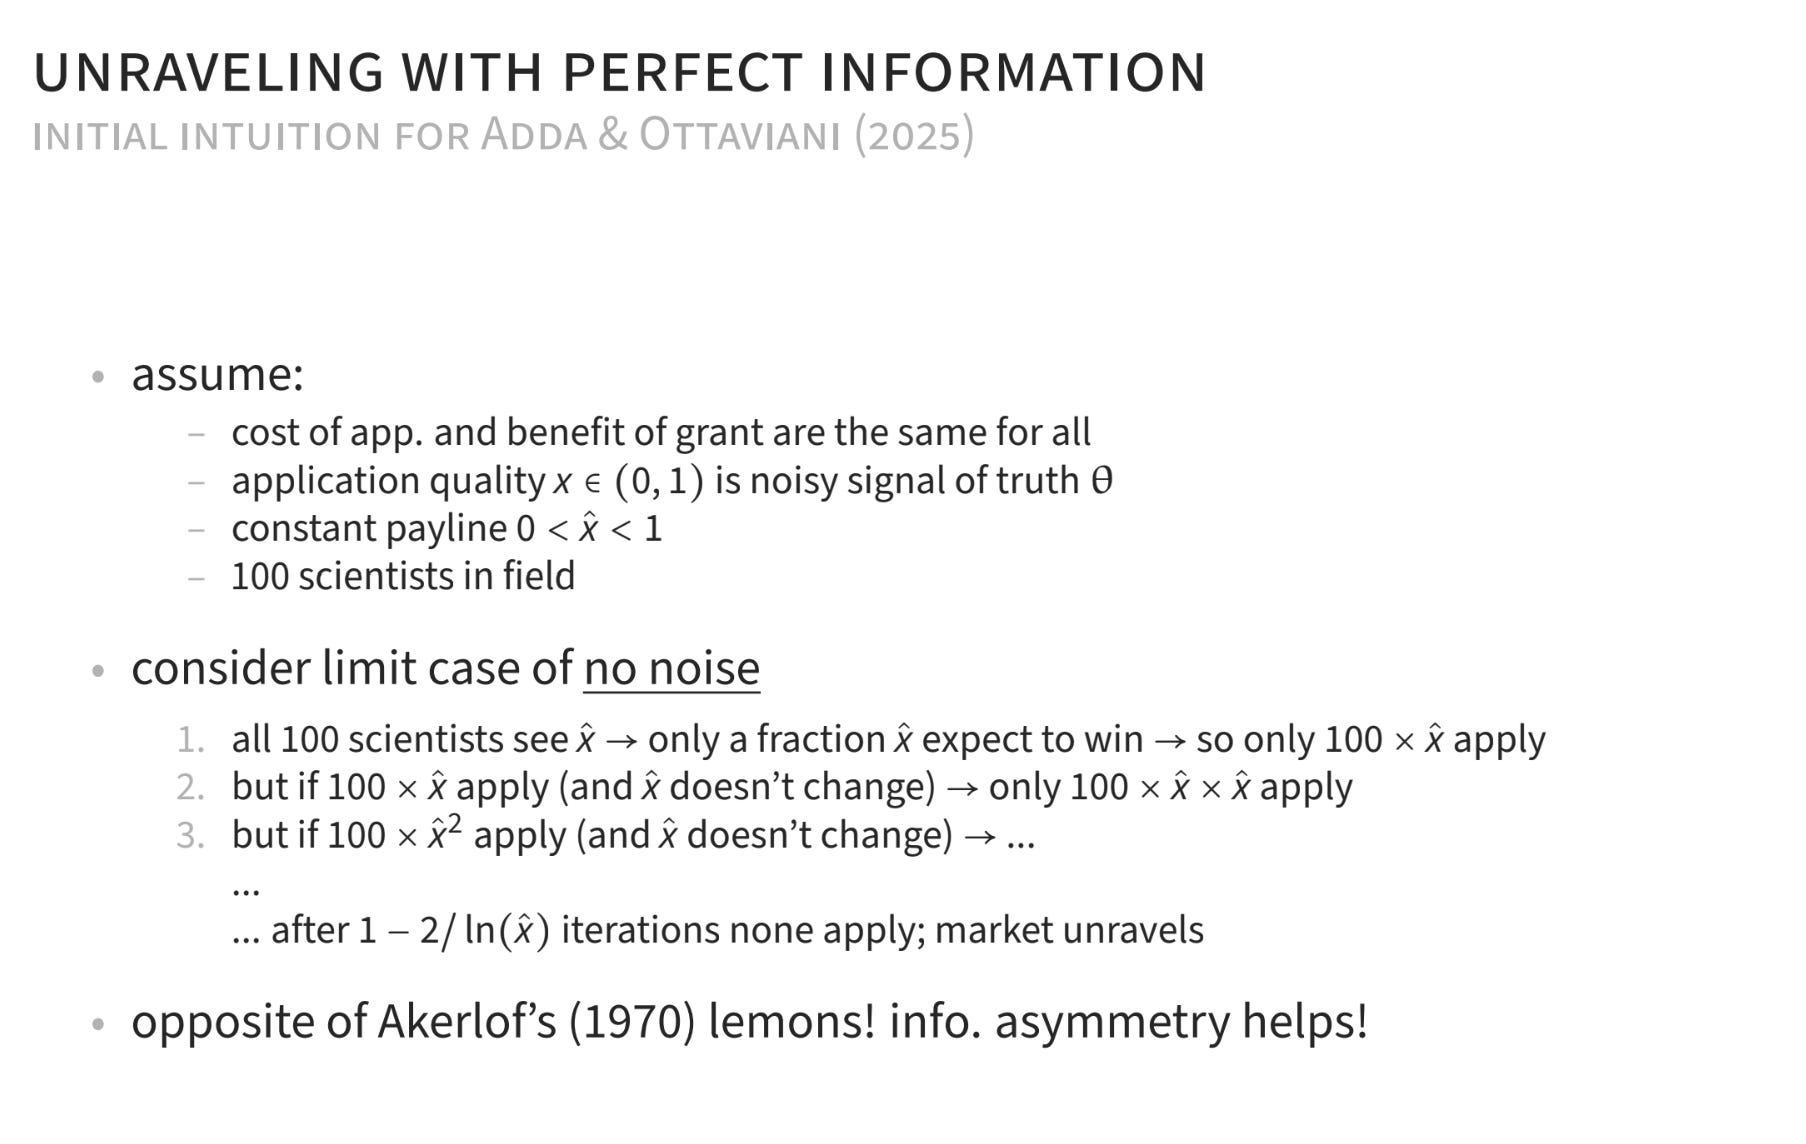
Let’s assume that every scientist has the same cost of applying and the same benefit if they get the grant. The quality that the funder is going to see is some noisy signal of the true quality of that application. Let’s say the funder is maybe a bit naive and is just going to say, “We’re going to fund the 20%, or 50%, or 10% best applications.” That’s the x̂. For ease of math, let’s say there are 100 scientists. Let’s say there’s no noise and that you see exactly the truth.
All 100 scientists see the announcement from the funder that only x̂ percent will win. Only x̂% of the 100 think they will win, so only 100 × x̂ will apply. But if 100 × x̂ apply, and the funder is naive and just sticking to their x̂, in this perfect-information world, only 100 × x̂ × x̂ will apply at this round of our iteration. You can see how, if you keep walking through this logic of how people’s expectations would update in this game, after that mathematical expression number of rounds, no one wants to apply.
Imagine that x̂ is 10%. With no noise 100 of us look out, and only the people who know they are the top 10 will apply, because they’re only going to fund the top 10%. Then they think, wait a minute, if only us top 10%, they’re only going to give an award to the top 10% of us, which would be the first person. Then the first person says, “I am but one person, so I guess maybe I will apply, depending on the rules. But if they’re only giving awards to the top 10%, then maybe I will not even apply, because I can’t submit a tenth of a percent of my application.” That’s the very stylized — not realistic at all — intuition of how, in this world of relative evaluation with perfect information, the market can actually unravel.
It turns out that a bit of information asymmetry keeps this kind of market from unraveling, because now people don’t know exactly their chances of winning, and that leads them to apply.
That sounds like, “Noise is in our favor.” It turns out noise is not exactly in our favor. I’m going to walk through this graphically using the really nice graph inside the review piece.
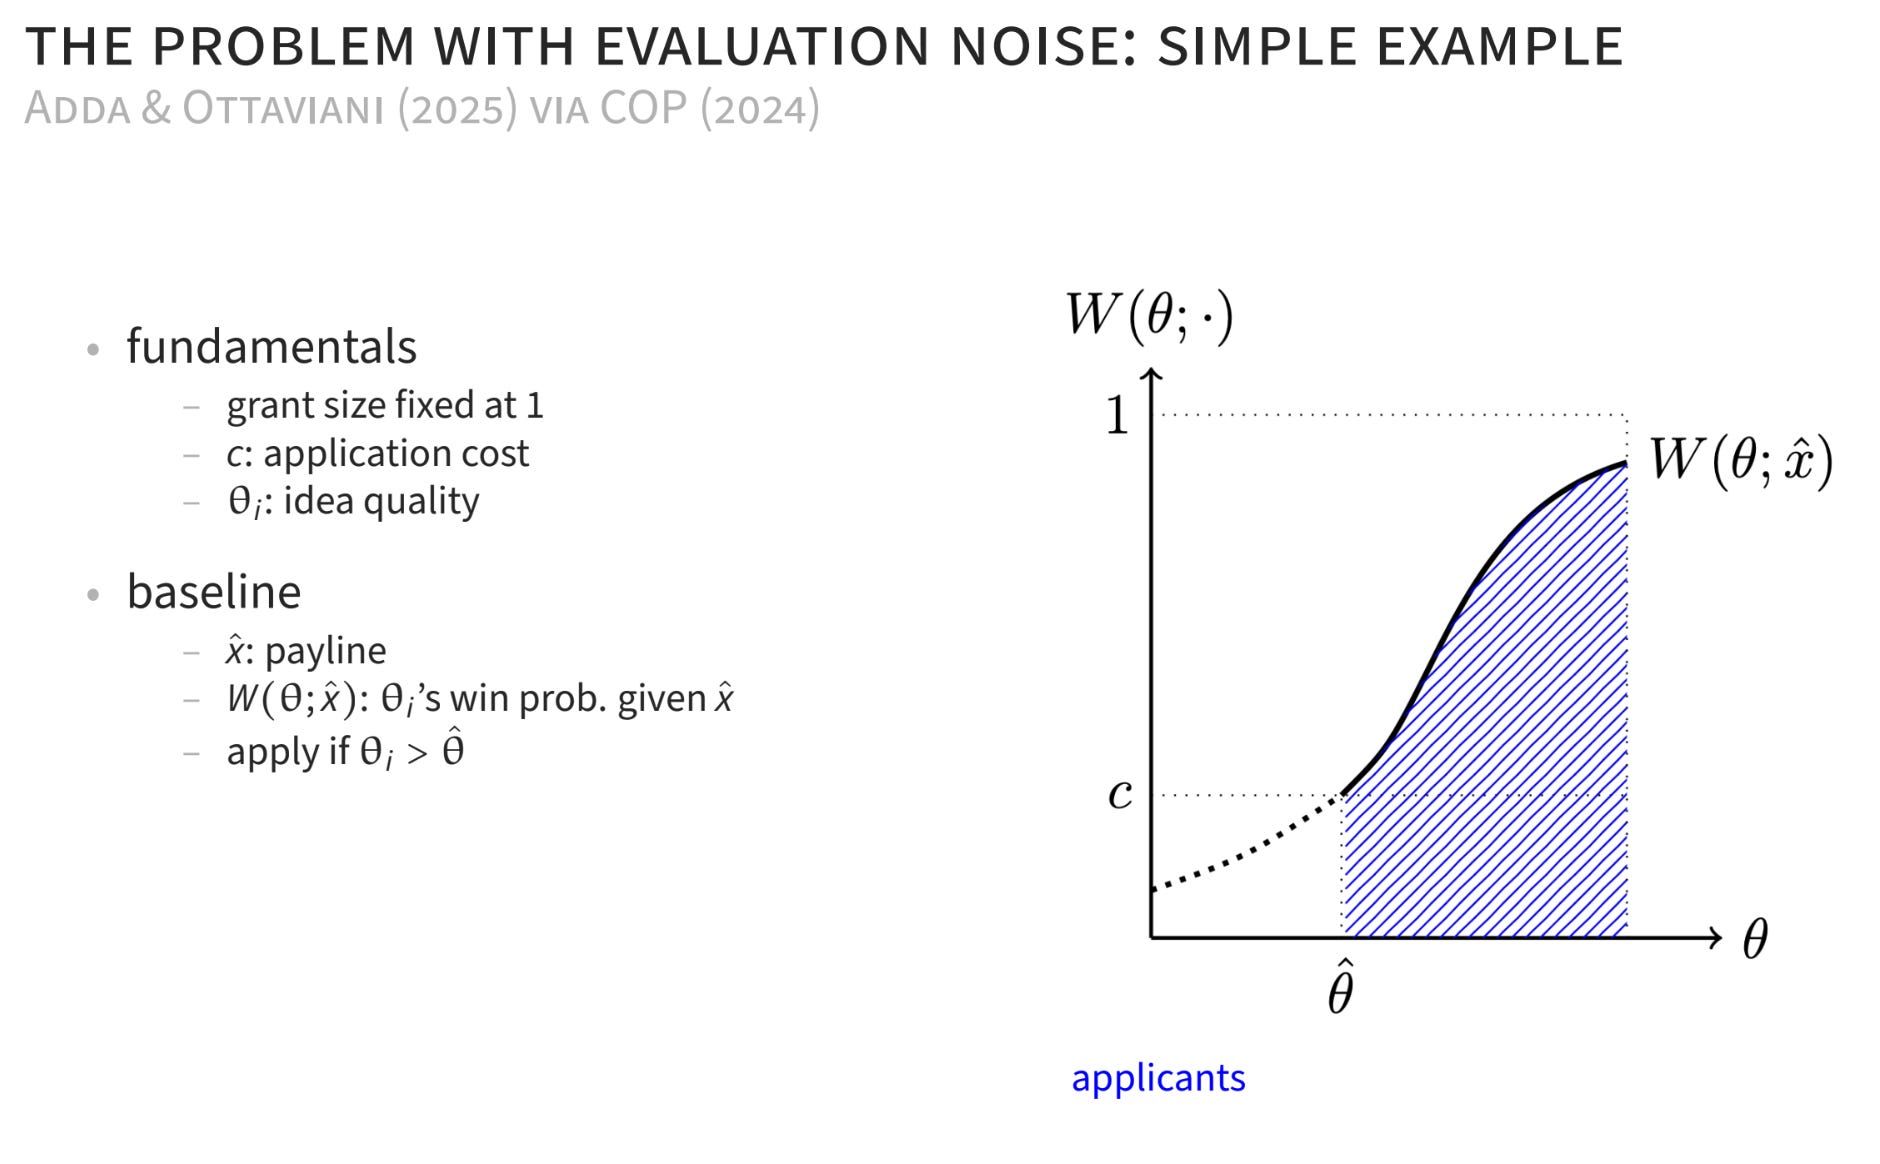
First, some fundamentals. The grant size, again for simplicity, let’s just call it 1. If you win a grant, you get a payoff of 1. Every person, in order to apply, has to pay some common cost, c. It’s a pain in the butt to write the application, and we all face the equal pain in the butt of writing it. But some of us have better ideas than others. Let’s consider a baseline setup where the funder is announcing this payline. Let’s say we can describe this system such that there’s this function W, which describes — for a given quality of an idea and the announced payline — the probability of winning. Then there’s some threshold θ^, which says, given the cost of applying, anybody with a θ above or equal to θ^ is going to send in their application.
That shaded blue area there is just the integral over W from θ^ upwards, and that tells you the number of applications you’re going to get. You can see it’s going upward, because people with higher-quality ideas are more likely to get funded. It gets concave eventually, because there’s some noise in the system, so even the person with the best idea has a chance of getting a bad draw. That’s why it doesn’t go all the way to 1.
Let’s do an intermediate thought exercise that’s not realistic but helps with intuition. Let’s add noise to the review process, but we’ll change the payline such that the same scientist, in terms of the quality of their idea, is on the margin.
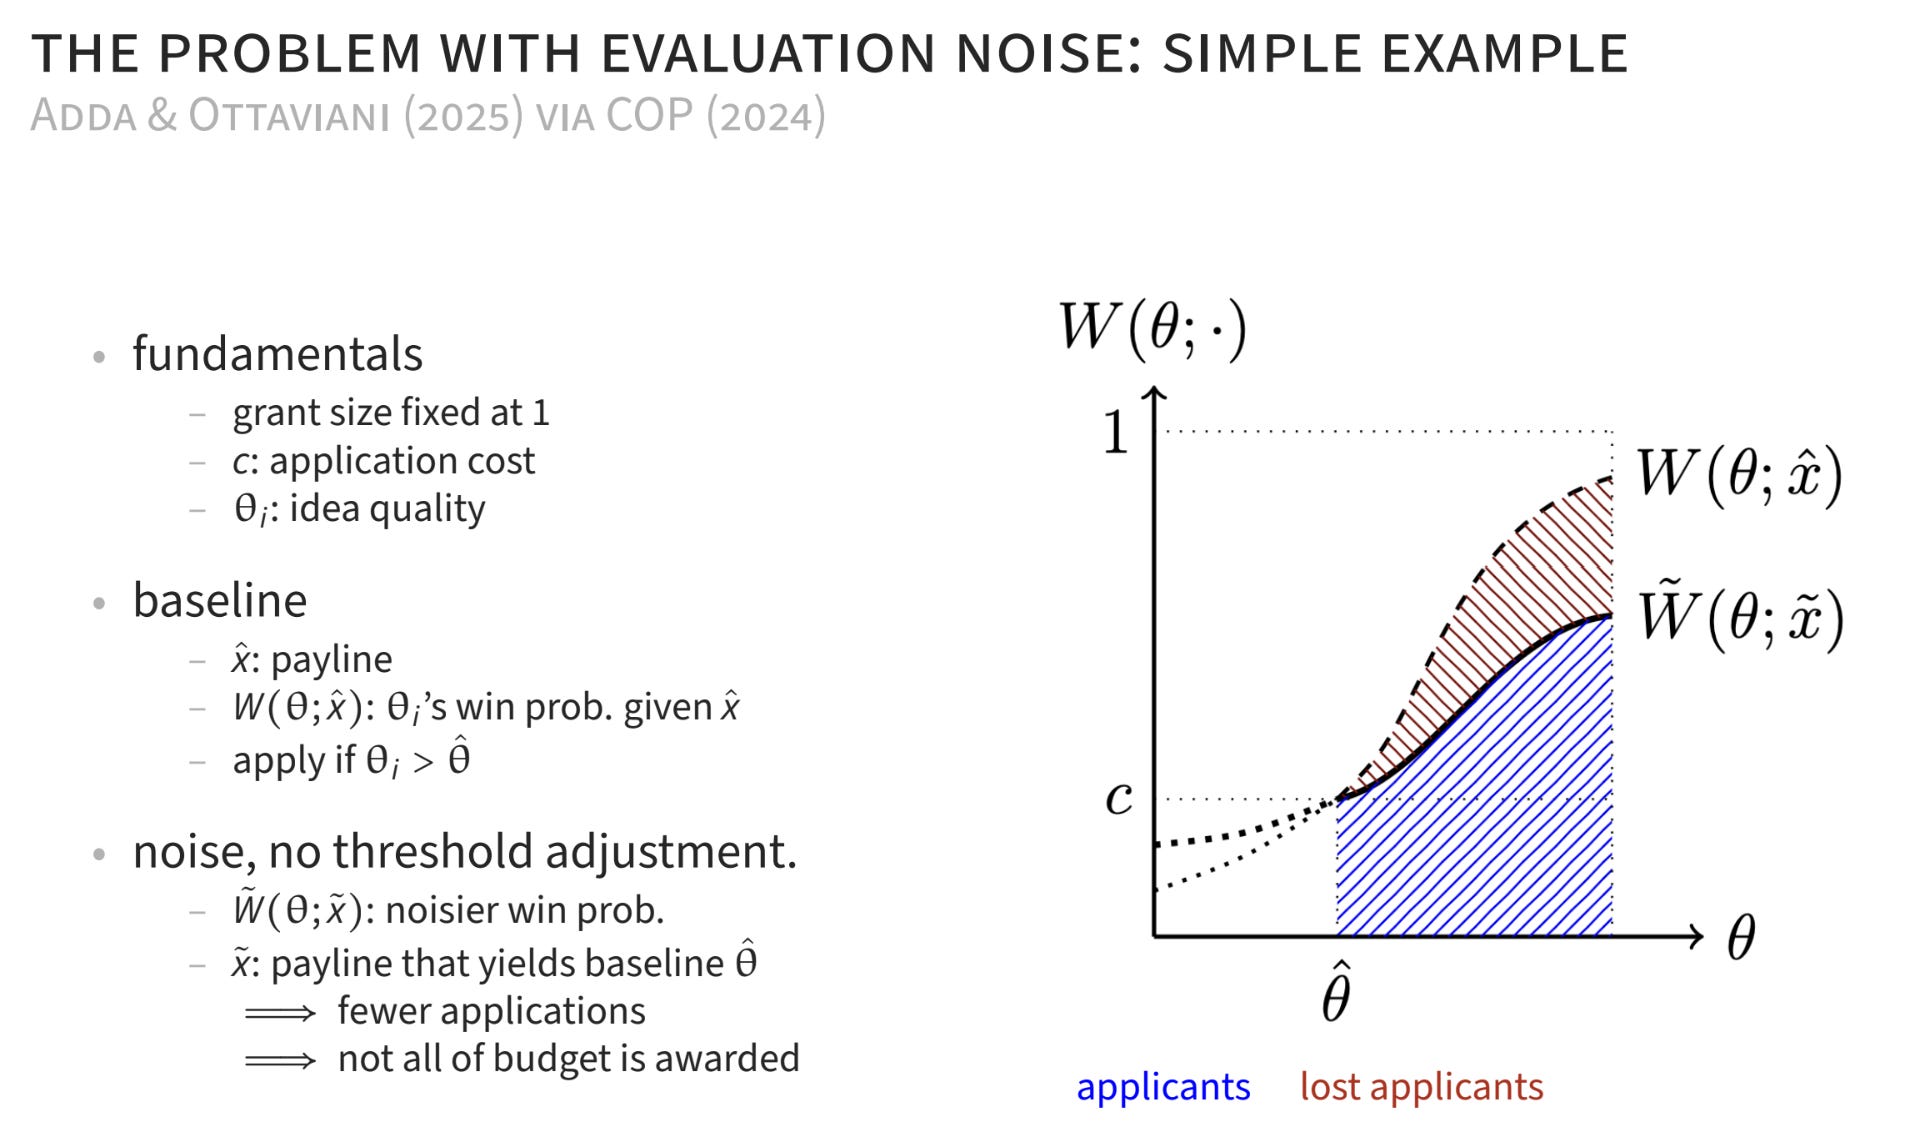
That is to say, we’re going to add noise to our review process, but we’re going to change the payline so that θ^ stays the same. That threshold that determines who’s going to apply is still the same in this noisier world.
What’s going to happen here? First, what does noise do to the payoff function? It makes it flatter. You can imagine a world where I have a terrific idea and Zachary has a mediocre idea, but the noise is infinite, such that when you see the signal of our ideas, Zachary could get a gigantic awesome draw. Even if I get a pretty nice awesome draw too, the amount of noise in the system is still such that everybody’s like, “Oh my gosh, Zachary’s idea is great.” In the world where noise was enormous, we wouldn’t be able to tell; everybody would have the same win probability. That’s why that W̃ is getting a little bit flatter. But we’ve artificially kept the θ^ threshold the same, so the same person’s indifferent. Mechanically, what happens is we get fewer applications. That blue area is smaller, and that red area is all the applications we’ve lost. In this probabilistic world, what we’re losing is every person with these high thetas is just less likely to apply.
Then you say, “If fewer people are applying, you have more money. You could expand the budget.” That’s what we’re going to do next. We’ve added uncertainty, so we’re giving out fewer awards, which means we have budget slack. The funder naturally says, “Why don’t we increase the payline? We can fund more stuff.” This is where things get interesting. What happens when you bump that payline out? You also bump out the threshold that determines which scientists are applying. You’ve got to push X back into the low-quality distribution to get more people to apply.
What the funder is trying to do is say, “I always want to fund this many people. This is my budget-clearing thing. I’ve got to get my money out the door to scientists.” If we have noise and don’t change anything, we’re going to fund fewer people. We need to attract people to fill in the lost applications from this noise, and the only place to fill them in from is the inframarginal people, going backwards into lower-quality ideas.
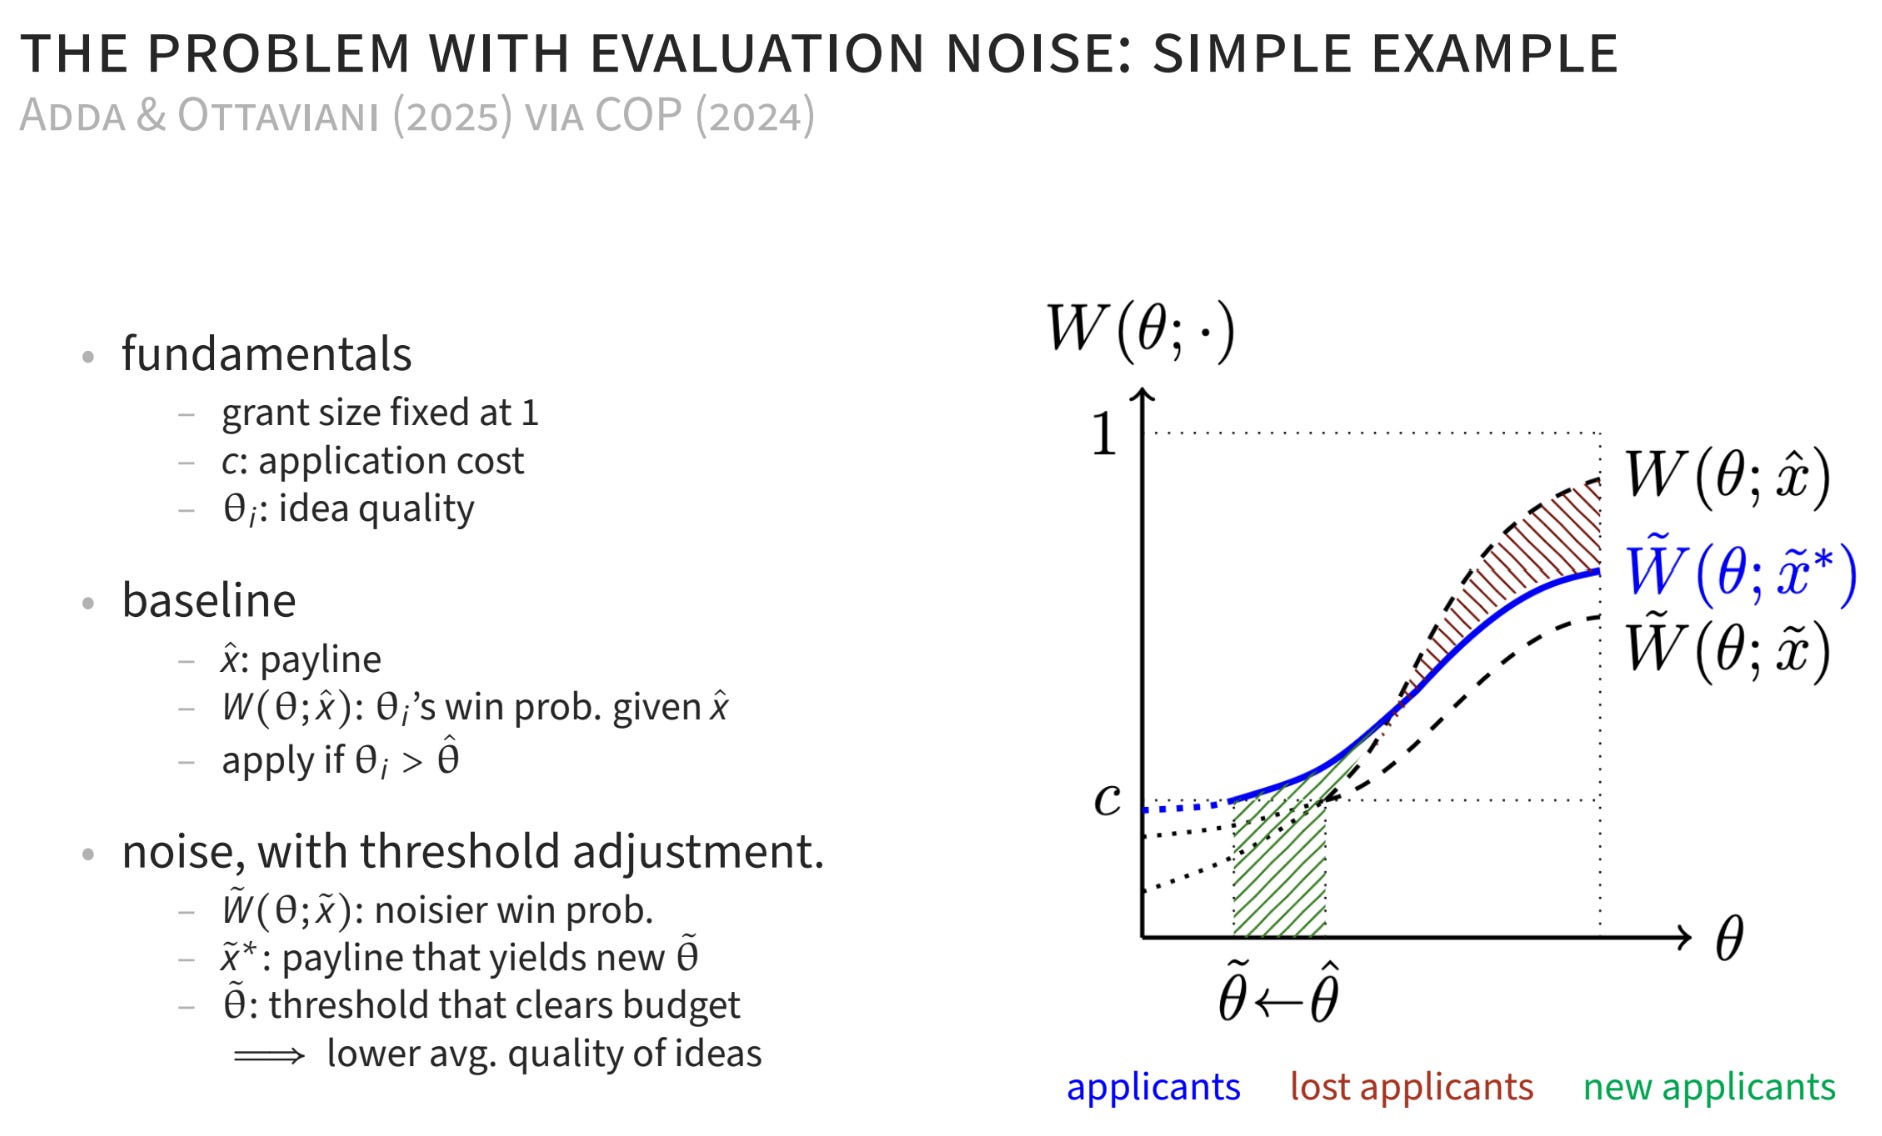
If you increase the noise in a field, that will require lowering the payline to attract more people to apply, and the people you’re going to attract will by definition be marginally worse ideas, because they weren’t applying until you lowered the payline. That’s setting aside a lot of very interesting behavioral biases and all sorts of things that could be going on in the wild world of science. But you can see how, in this nice self-contained simple world, more noise is going to hurt the average quality of the people competing for that money.
The last step of this paper takes it into how this can raise some really interesting dynamic problems. To recap where we were: the proposition this paper makes is that if there’s more noise, it’s going to eat more of the budget of your institution. The logic goes as follows. On our prior slide, we showed how, when there’s more noise in a certain review period, you’re going to get more applications, because you’re going to have to lower the payline, so more people apply, and they’re lower-quality people as well.
This paper emphasizes the important point that a lot of the ways institutions operate in practice is that they tie budgets to applications. That is to say, your budget in period t+1 is some increasing function of how many applications you got in the period before. Now you can start to see where this is going to generate problems. If some area starts to get noisier, it’s going to get more applications, and it’s going to get more money. That’s going to be more money going to lower-quality applications.
Their empirical setup is looking at the European Research Council (ERC), because it’s a place where they have a decent way of measuring noise in the review process across different fields. This is me showing one of their figures, where on the x-axis is a measure of the inverse of the variance of the review scores. This is the inter-rater agreement.
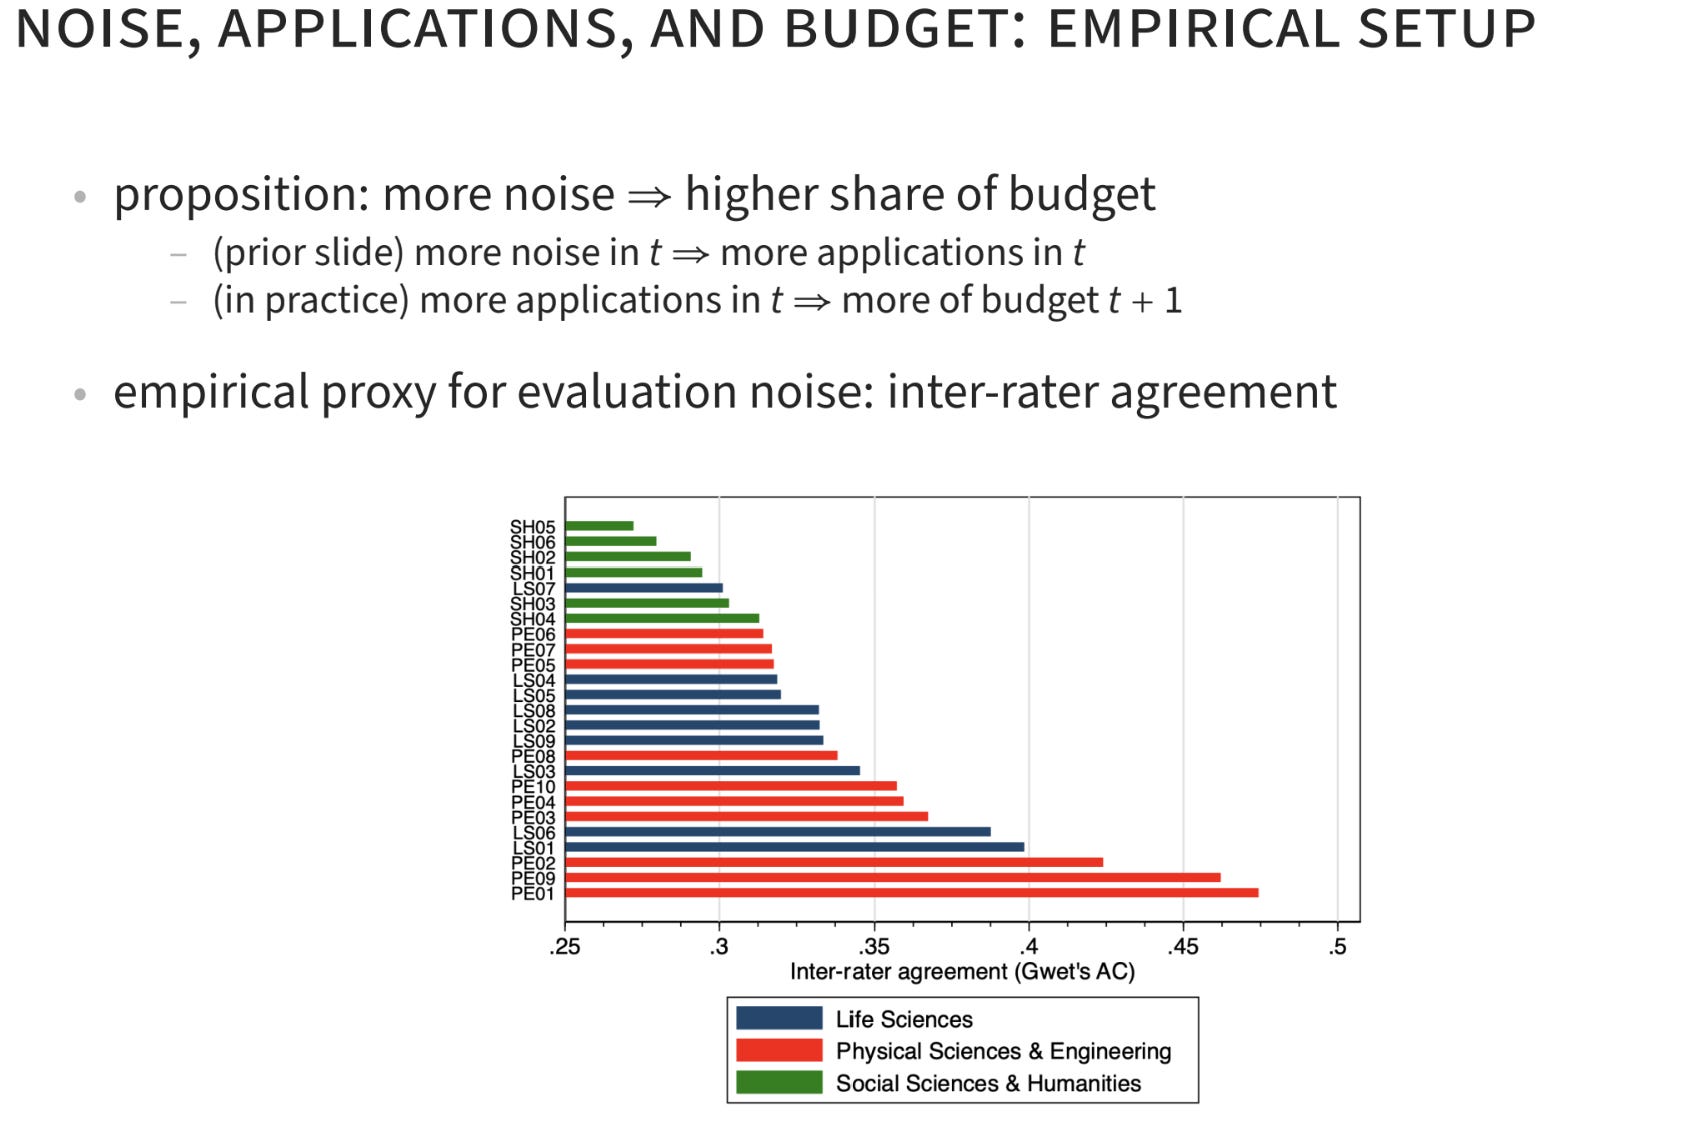
A large number means that when a bunch of people see the same proposal, they tend to agree on the quality of that idea, and low numbers mean they tend to disagree. Already, in line with intuition, what you might call the hard sciences — biology, physics kinds of things — have more inter-rater agreement than the social sciences, where we’re dealing with the messy world of humans and we don’t have molecules that we can be very clear about all the time.
The hypothesis of this paper is: if the fields that have high inter-rater agreement start to have to compete for budgets with these low inter-rater agreement fields, those low inter-rater agreement fields are going to start to eat the budgets of the high inter-rater agreement fields. That’s exactly what they find in practice.
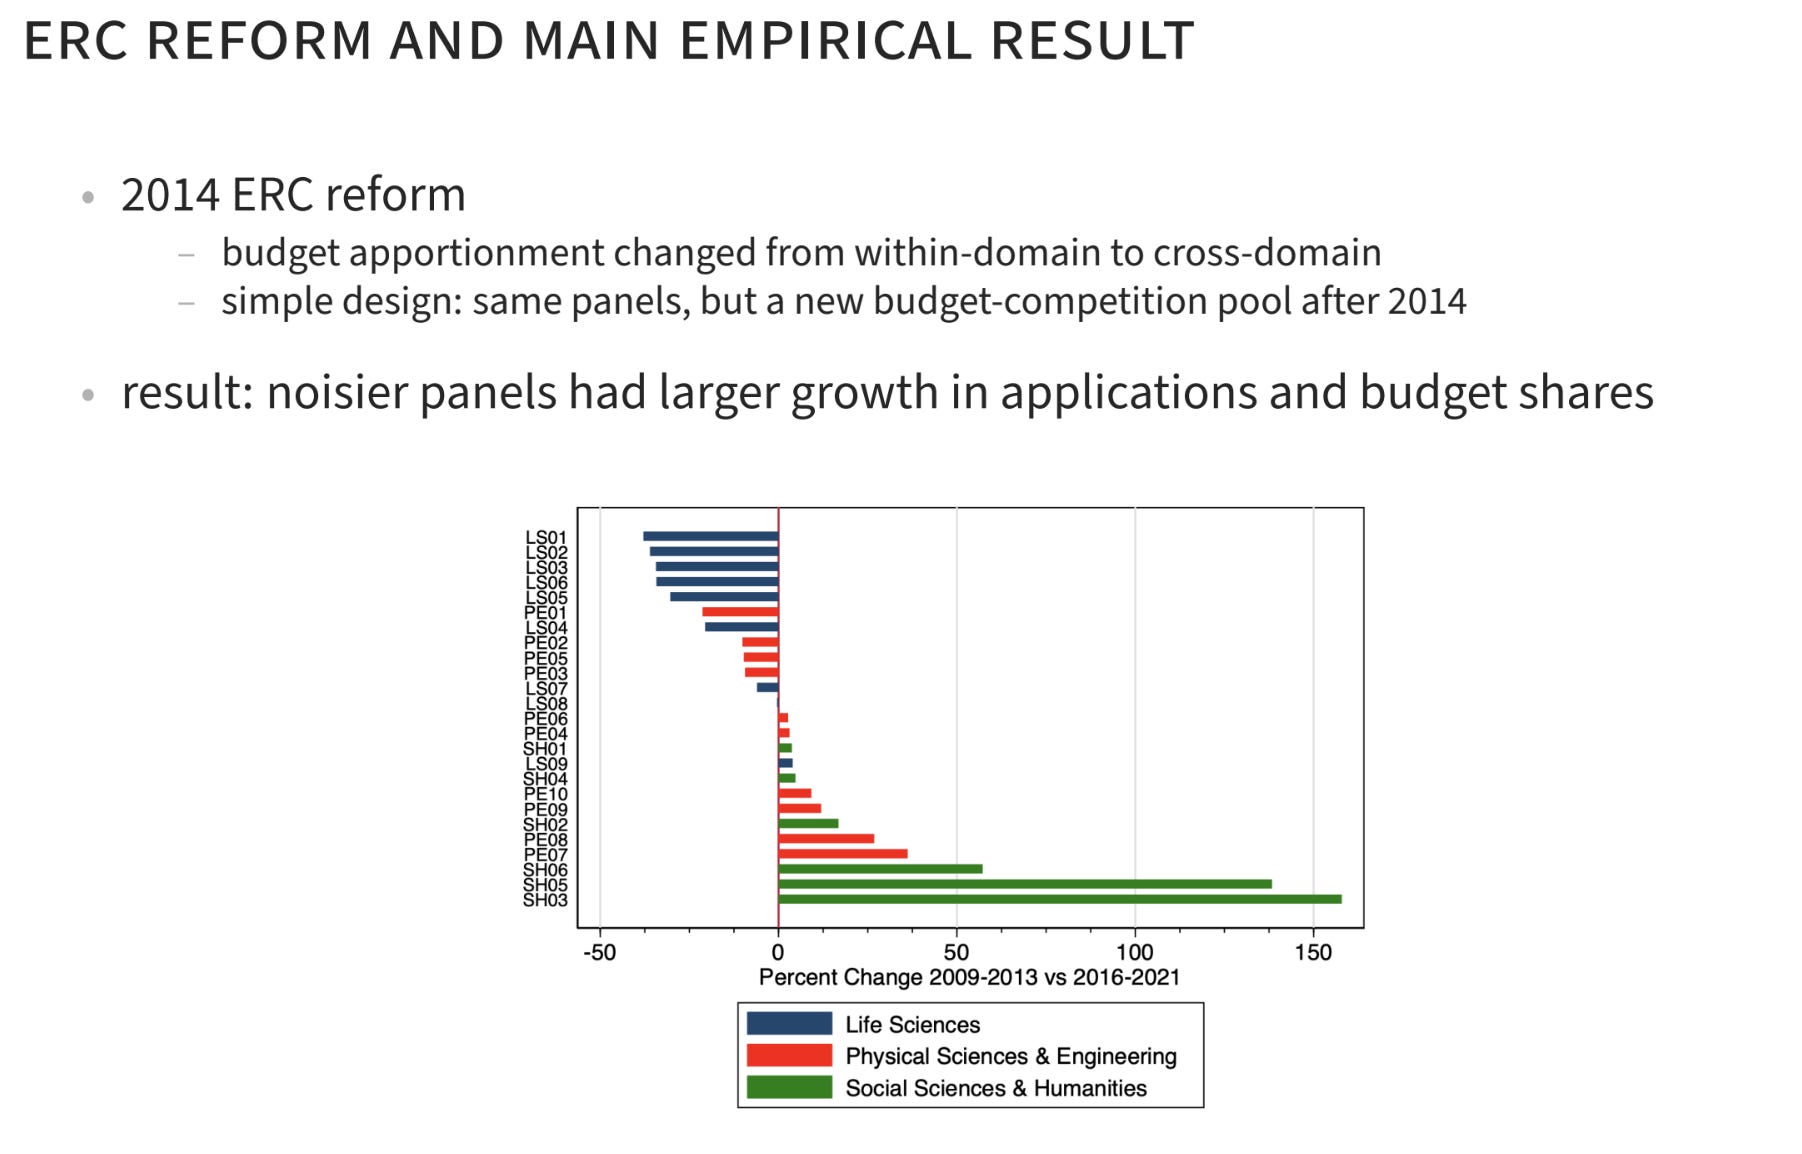
There was this big reform at the ERC where, instead of budgets being defined on very narrow levels, they started to expand it. If you had a noisy field through the lens of their model, that field would start to have more applications and would start to get more budget from other fields that had less noise. Going back and forth, you can see all of our noisier fields of the social sciences in green down here. The theory of this paper would suggest that if they started to have to compete for budgets with these up here, they would start to eat those other fields’ budgets, and that’s exactly what you see in practice.
There are lots of interesting things going on here, and taking noise seriously, and what it does to grant systems, is very important. It also raises all sorts of questions about what’s going on inside of peer review. If you’re interested in this, Kevin Boudreau has a very nice review paper that just came out a few weeks ago, focused on experiments done in this space. I call it the Wild West, because there’s lots of really interesting experimental work. Something that’s very unclear at this point is what the long-term effects of different peer-review arrangements are, because, as we talked about at the beginning with the war-on-cancer example, a lot of the real effects of science take so long to manifest that it’s hard to set up good experiments on what’s the right way to peer review, or what makes a good peer reviewer. These are lots of interesting open questions.
Designing grants
Back to our grant pipeline. I want to talk now about the design of the grants themselves: how much money, the structure of the grants, what can you do with the money, when should you be audited, all sorts of things. There’s lots of very interesting theory here. The one I want to focus on is a notion raised by Gustavo Manso’s paper, Motivating Innovation, which builds on a lot of earlier work on principal-agent models. If you want to get people to do high-risk things, you need to give them incentives that tolerate early failure and reward long-run success.
One of my favorite tests of this theory is a fun lab experiment that Florian Ederer and Gustavo Manso did, Is Pay for Performance Detrimental to Innovation? where they ran an adorable little lab experiment.
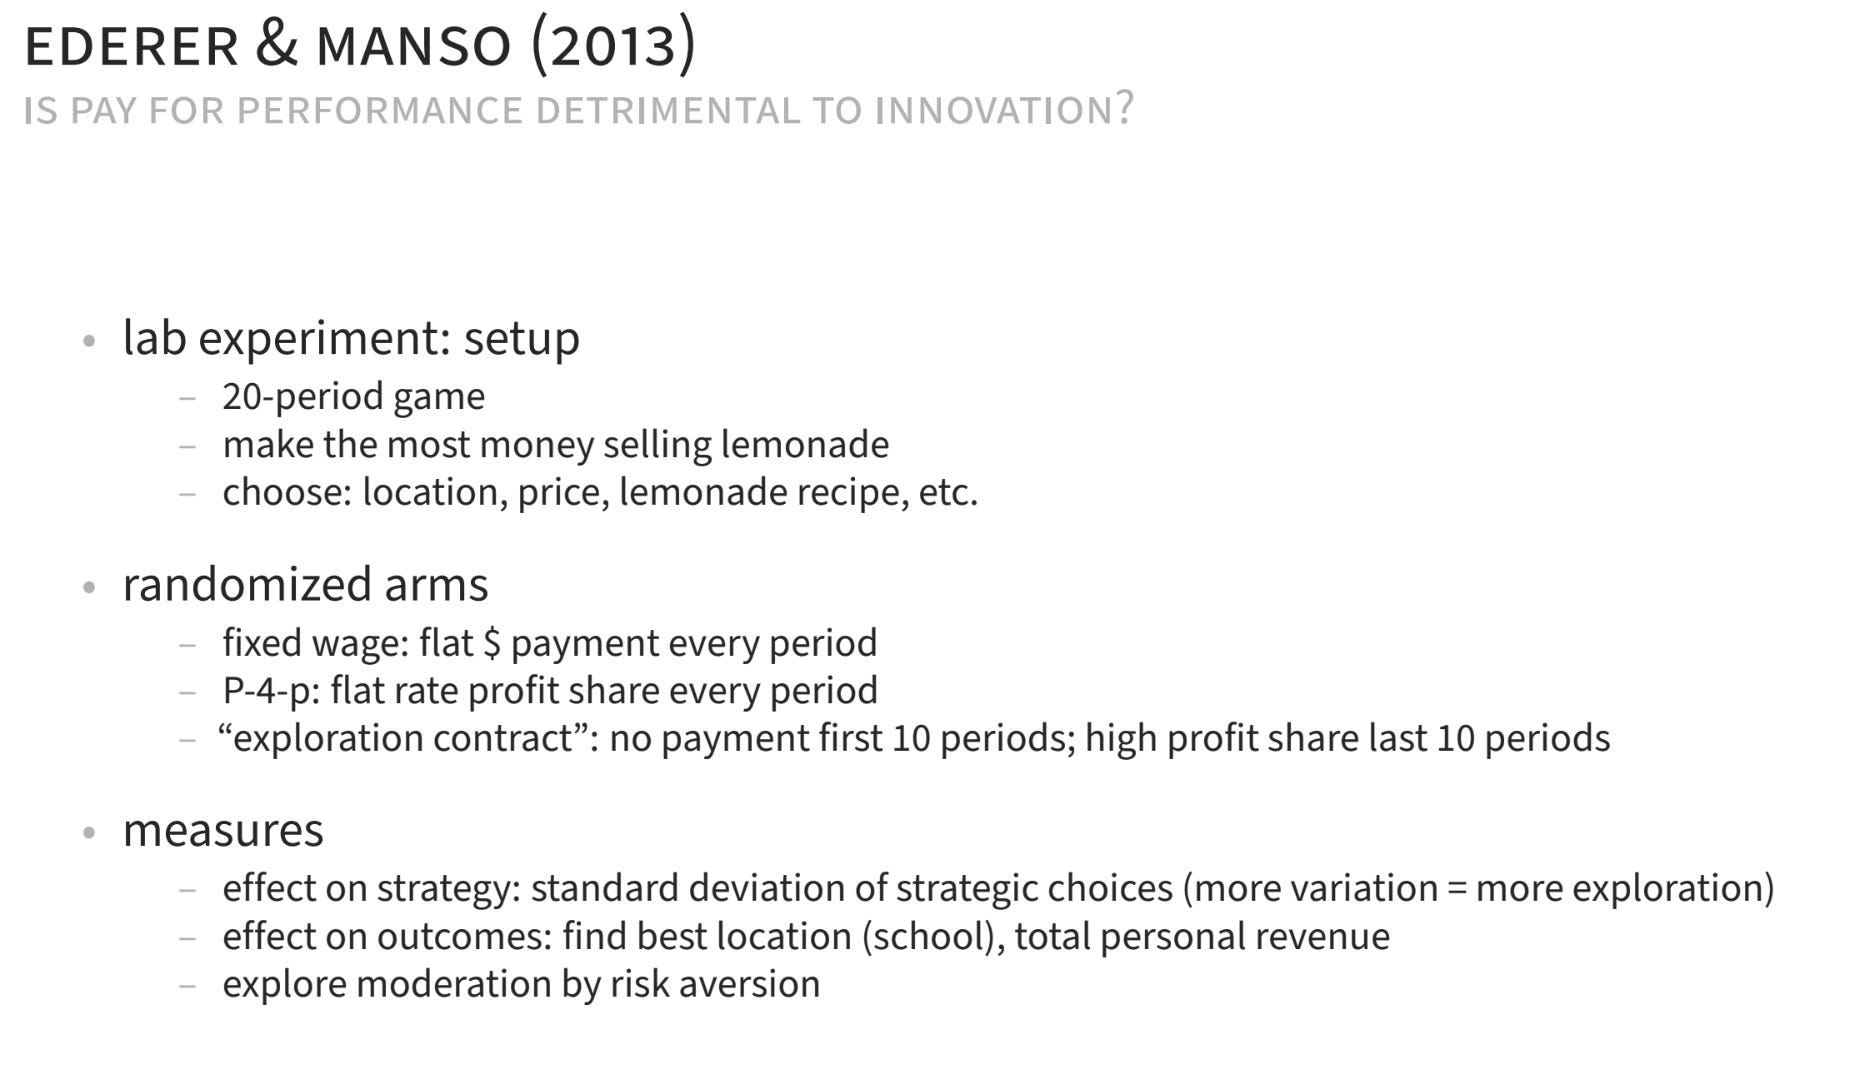
Imagine you have to play a 20-period video game and you have to sell lemonade. This is like some little game you would play on your phone, where you have to choose where you set up the lemonade stand, what price you’re going to charge, how much sugar you’re going to put in, etc. The analog is, you’re a scientist and you have to choose where you’re going to do your research, who you’re going to hire — lots of choices, and you don’t know what the payoffs are from all these different combinations of choices.
In the experiment, they have three arms.
Every period you will get a flat payment regardless of how much money your lemonade stand gets.
The pay-for-performance arm, which is, you’re going to get a fixed share of the profit your lemonade stand has.
The exploration contract, which has some analogues to the kinds of things you might think would be optimal for a scientific environment: you’ll get no payment for the first 10 periods, but then you get a higher profit share in the last 10 periods. Implicitly, you can see how the goal there is, you’re not getting paid at the beginning anyway, so try some stuff, see what happens, so that when your payments start to come in, you’ve found something that is high-reward.
They’re going to measure what this does in terms of how it affects people’s strategy, with the idea that — this is another use of variance as a measure — if this really does incentivize exploration, you should see people trying a lot of different things. So they’re going to look at the standard deviation of these different strategic choices. Then they’ll look at the actual amount of money these people have made, and they’ll also do some nice moderation, trying to see how much this might depend on these subjects’ risk aversion.
Here’s the graph plotting the standard deviation of the strategy choices across the three arms in the two chunks of periods, the first 10 and the last 10.
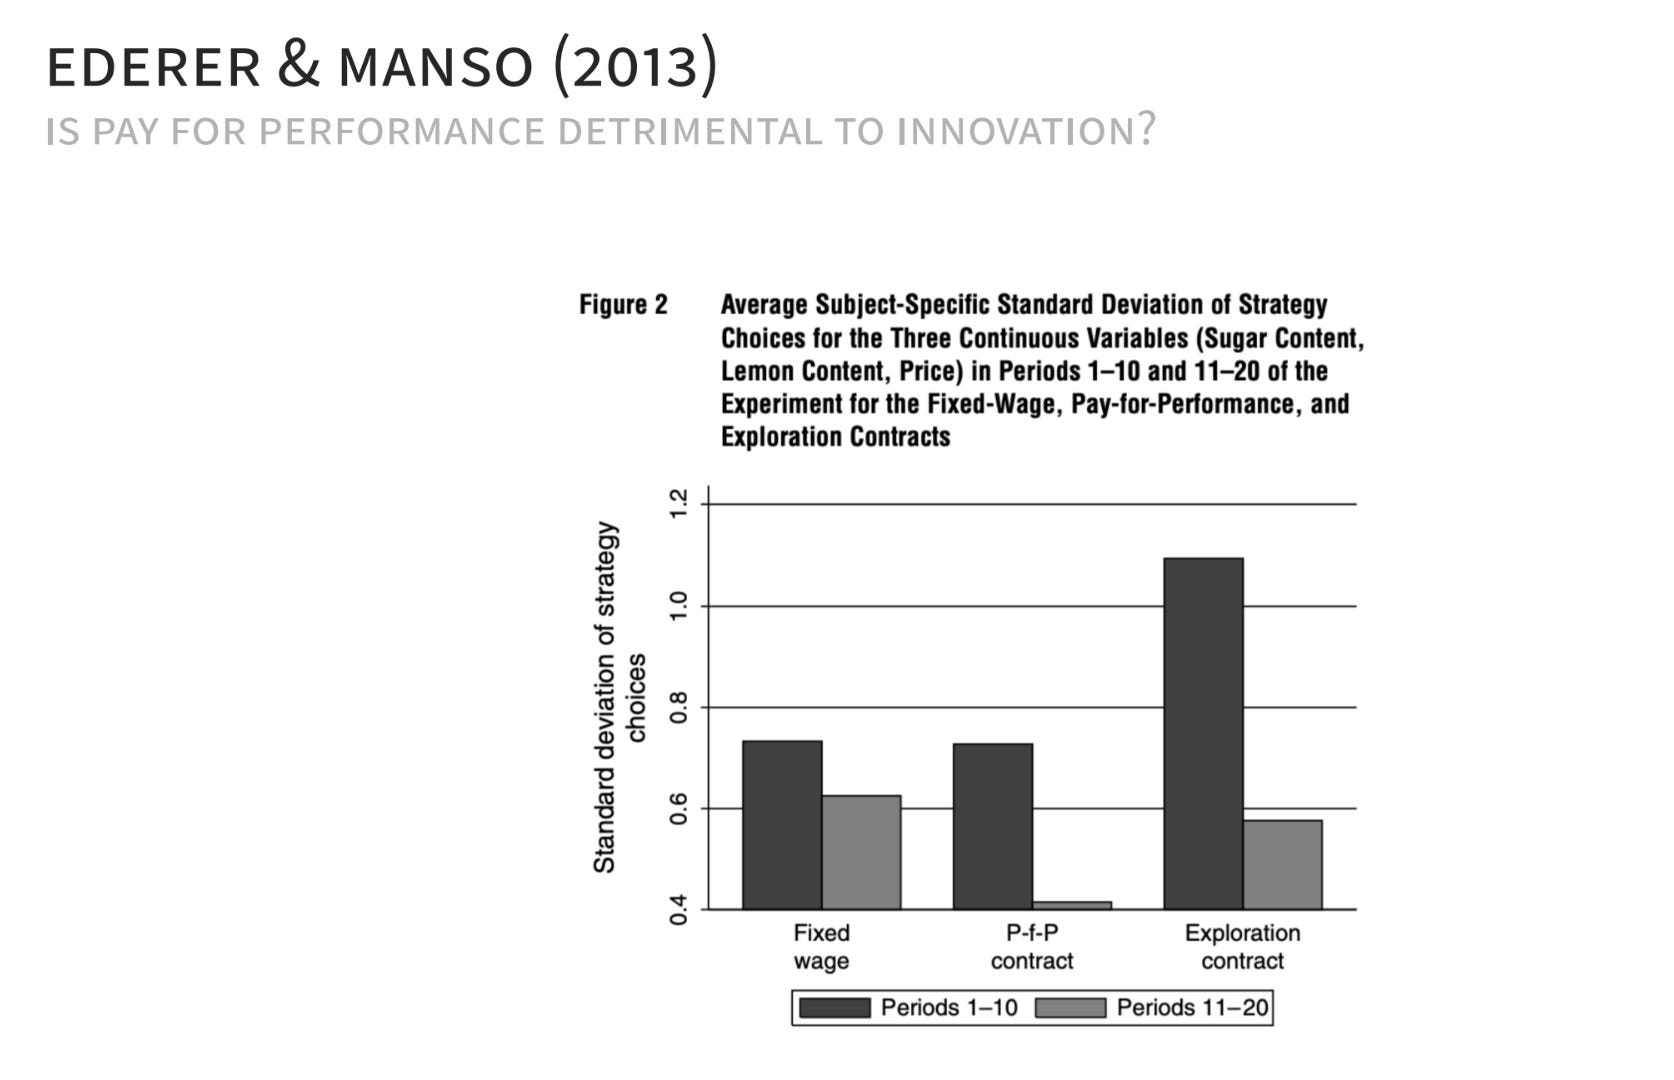
Exactly as the theory would suggest, those in the exploration contract tried a lot of different things compared to the others in the first 10, and then settled down. So there’s a first stage of sorts: they did different things. Was it actually helpful in the context of this game? The answer is yes.
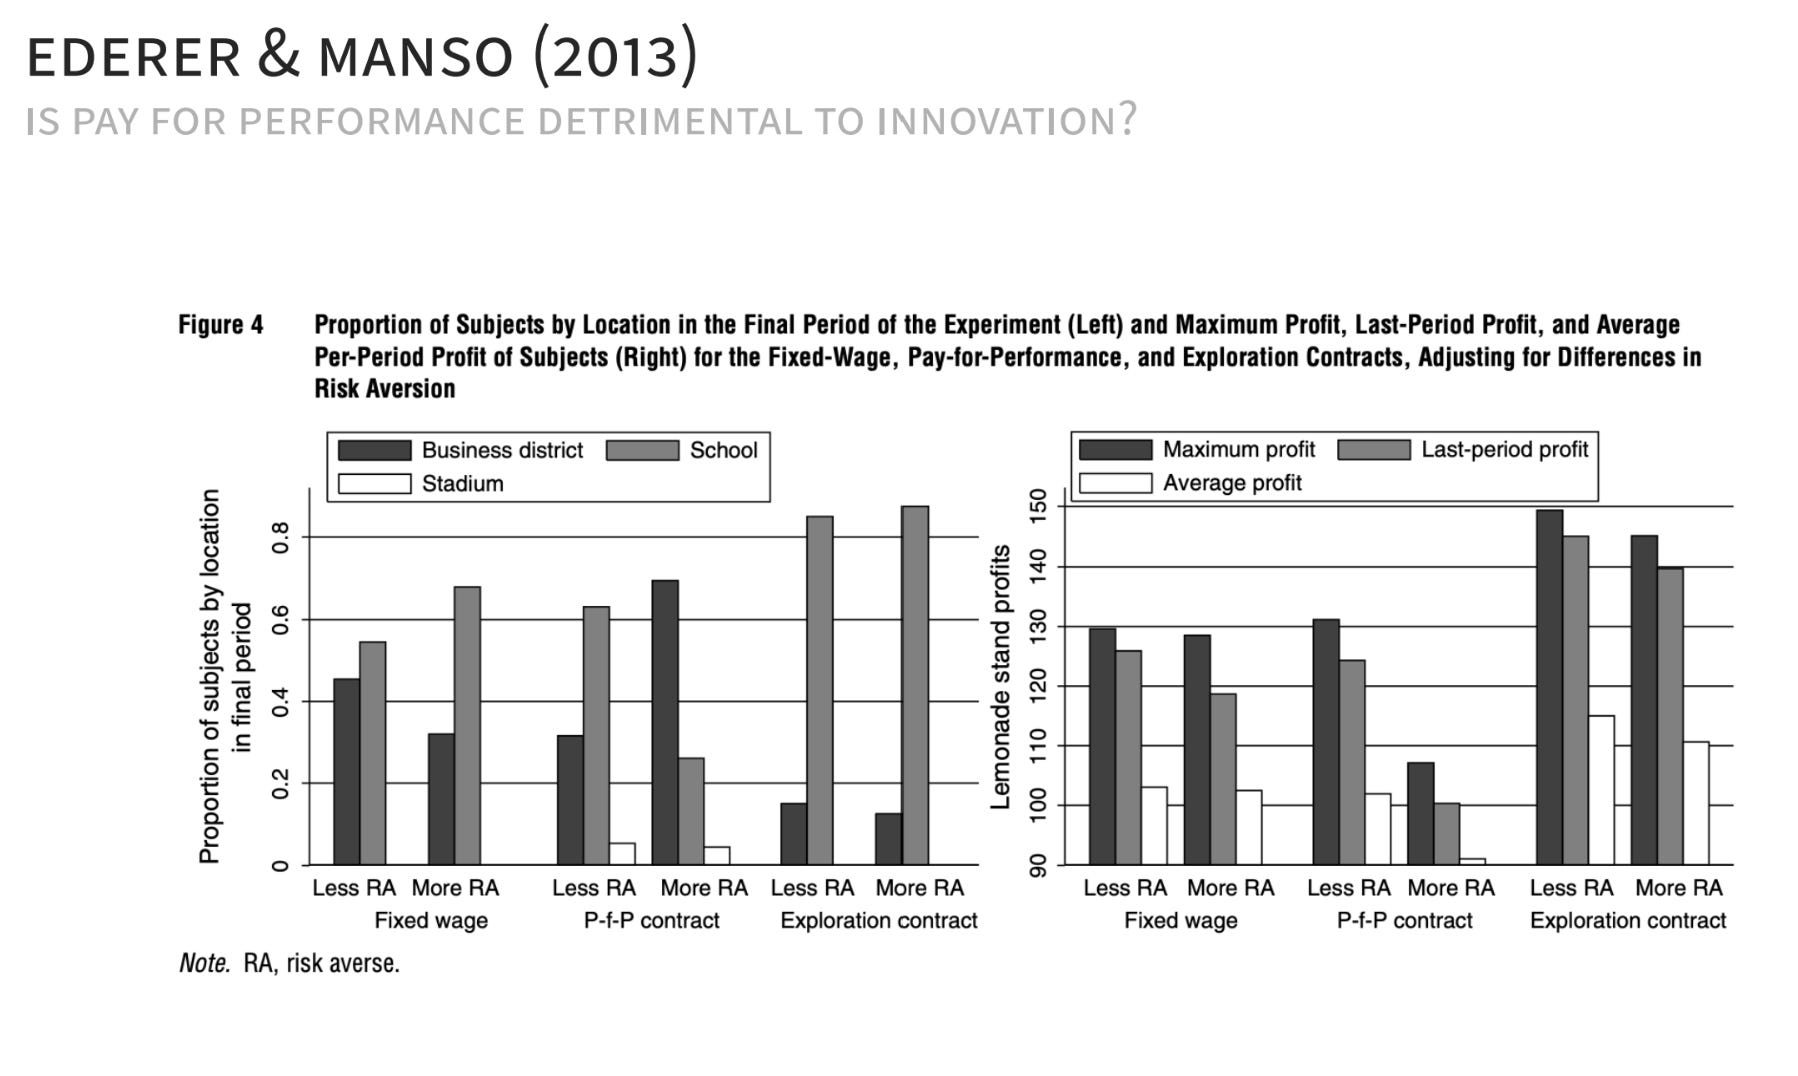
On the left, it turns out the school was the best place to put the lemonade stand, so they’re showing the share of the subjects that found the school, and you can see the exploration contract is where basically everybody found it: 80% of the people found it.
The interesting thing here is the actual profits to the subject in the different arms. Whether you measure this by their maximum profit per period, or the profit in the last period, or their average over all of the periods, they did the best. They explored, they found the right combination of things, and once they found it, they stayed on. One other interesting thing is that, comparing the pay-for-performance contract, people who were risk-tolerant did pretty well in that contract, but people who were risk-averse fared quite poorly in the pay-for-performance contract, where you were getting a share of profits every period. Whereas in the exploration contract, your risk aversion didn’t matter, because you’re shielded from the risk entirely in those first 10 periods when you try different things. This was a proof of concept that this might be an interesting thing to really push on.
Then there’s a nice paper by Pierre Azoulay, Josh Graff Zivin, and Gustavo again, Incentives and Creativity: Evidence from the Academic Life Sciences, that does the best of trying to say, “What’s a real-world analog of this kind of arrangement with scientists?” They focus on the Howard Hughes Medical Institute (HHMI) investigator program, which does a lot of things that, compared to the traditional NIH grant that a lot of these people would be eligible for, look like the exploration contract: it’s longer funding, there are fewer reviews, there are fewer strings tied to what you can do with the money.
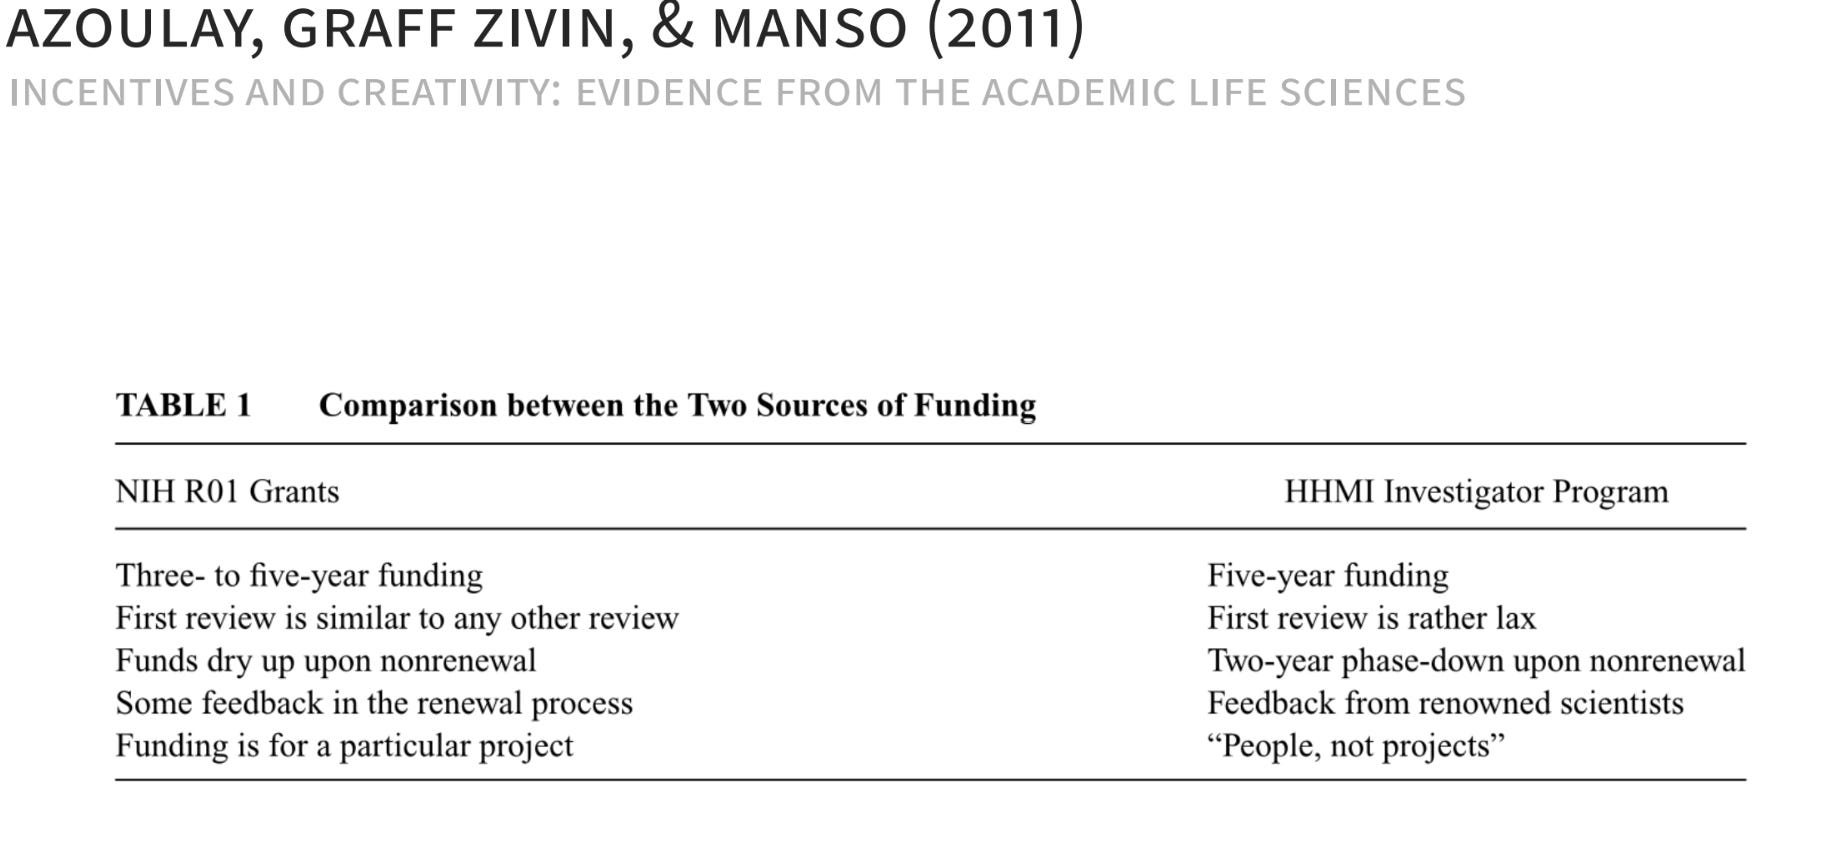
They wanted to say, “If we do our best to find two scientists, one who got an HHMI grant and one who looked as similar as possible on observables but didn’t get an HHMI and instead got an NIH grant, how would they fare?”
This is one of the results you can see in the paper.
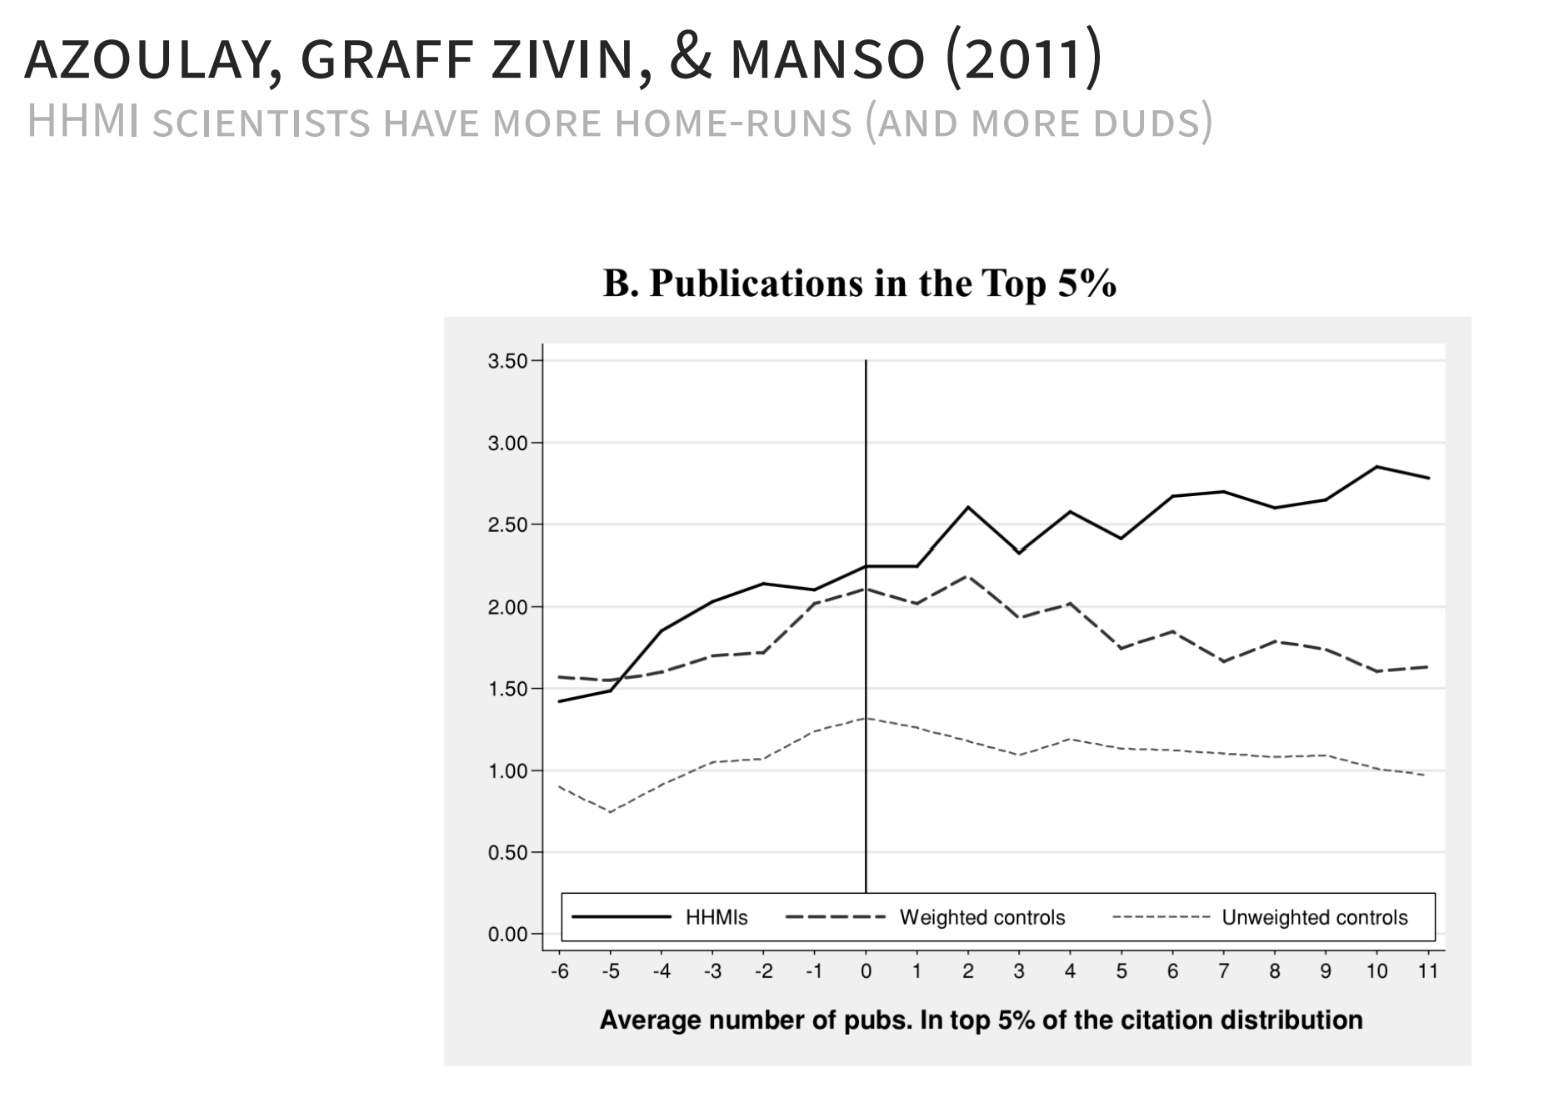
If you focus on the weighted controls, you can see that our HHMI and NIH scientists are trending together towards this common period where they’re both going to get resources, but one gets HHMI and one gets the NIH, and afterwards they depart. This is by no means an RCT, because we don’t have the kinds of data on the HHMI shortlist to know who was the marginal HHMI that just didn’t get it and who was the marginal NIH person that just didn’t get it. The authors did their very best to find a good treatment and control group, but at the end of the day there’s still a question of how much of that gap is due to the HHMI structures per se versus HHMI being very good at spotting scientists who are talented.
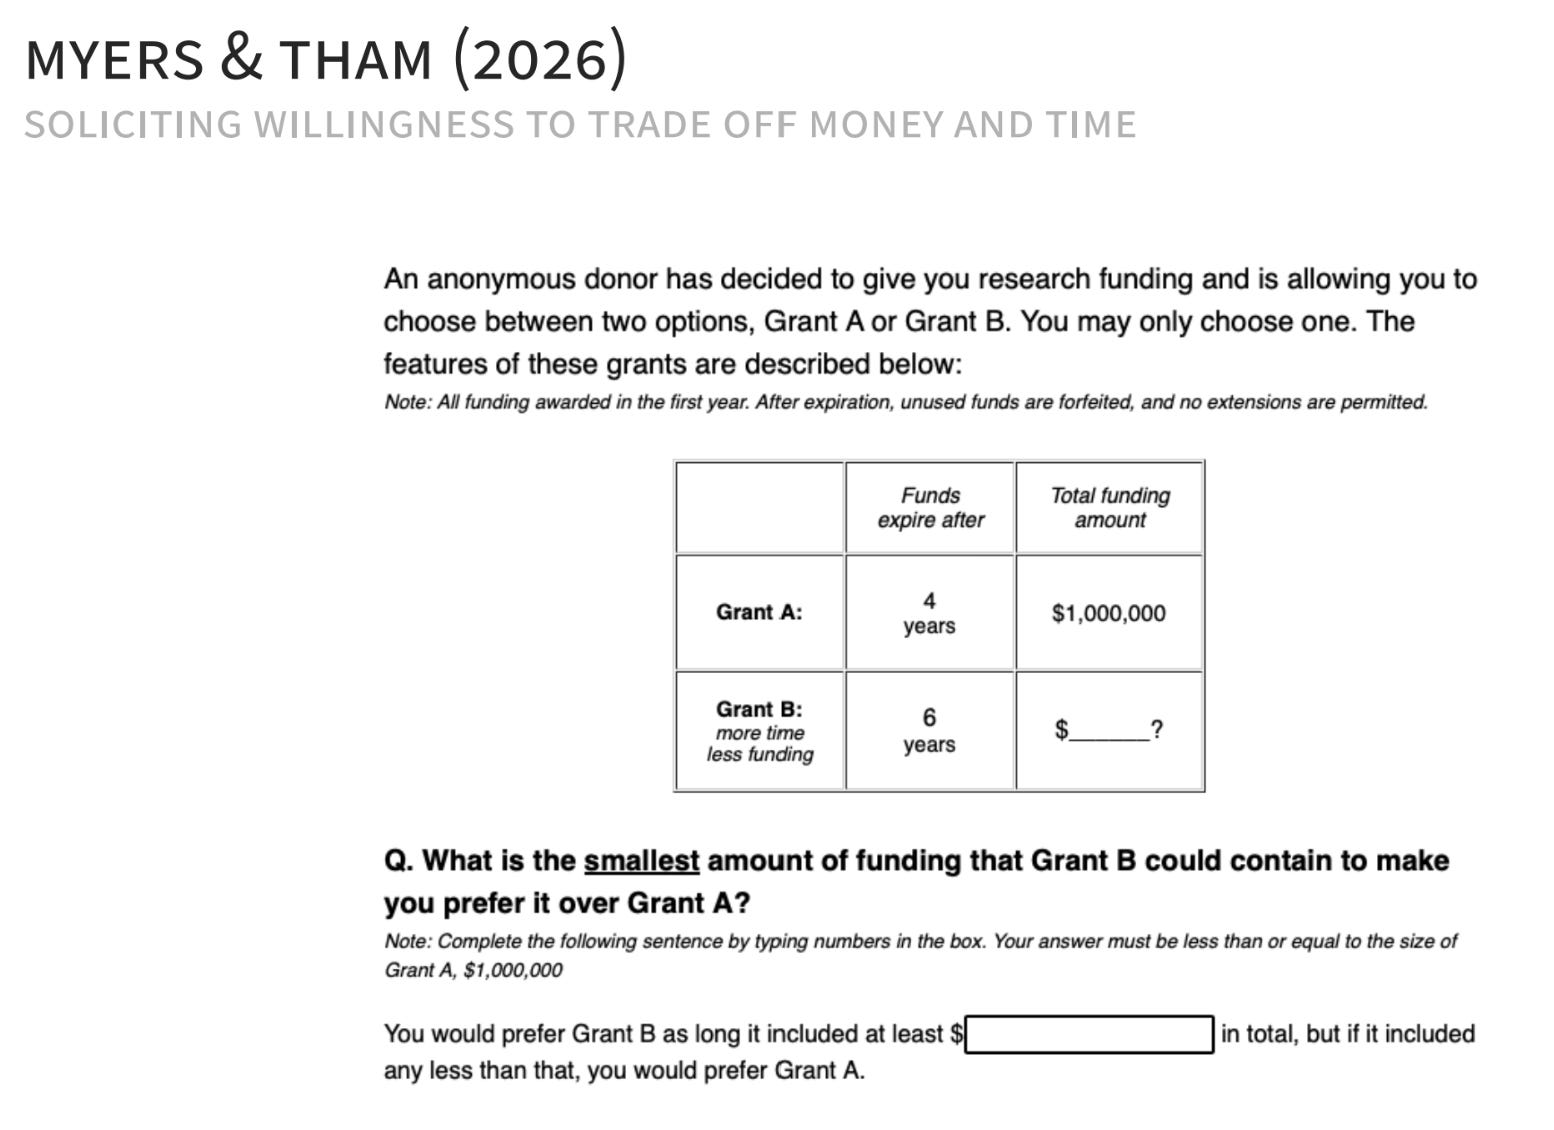
Which is why my colleague Wei Yang Tham and I were then like, how much of this is due to the grant per se? That was our question in Money, Time, and Grant Design. How much is this really because people have more money or more time in their grants? We don’t have $1 billion that we can randomize to run that experiment, so we did what we thought was the next best: we ran a survey with actual scientists across all fields of science, not just the life sciences. We asked them what they would do if they got grants of different amounts and with different durations over which that money was available to them. The implicit argument being, if these contractual arrangements around the grant design really matter in practice, then when we give people fake long grants, they should say they’re going to be more likely to take risks in their work, as the theory would suggest, if the grant design itself was the important constraint on their risk-taking.
This was the setup of the question we asked.
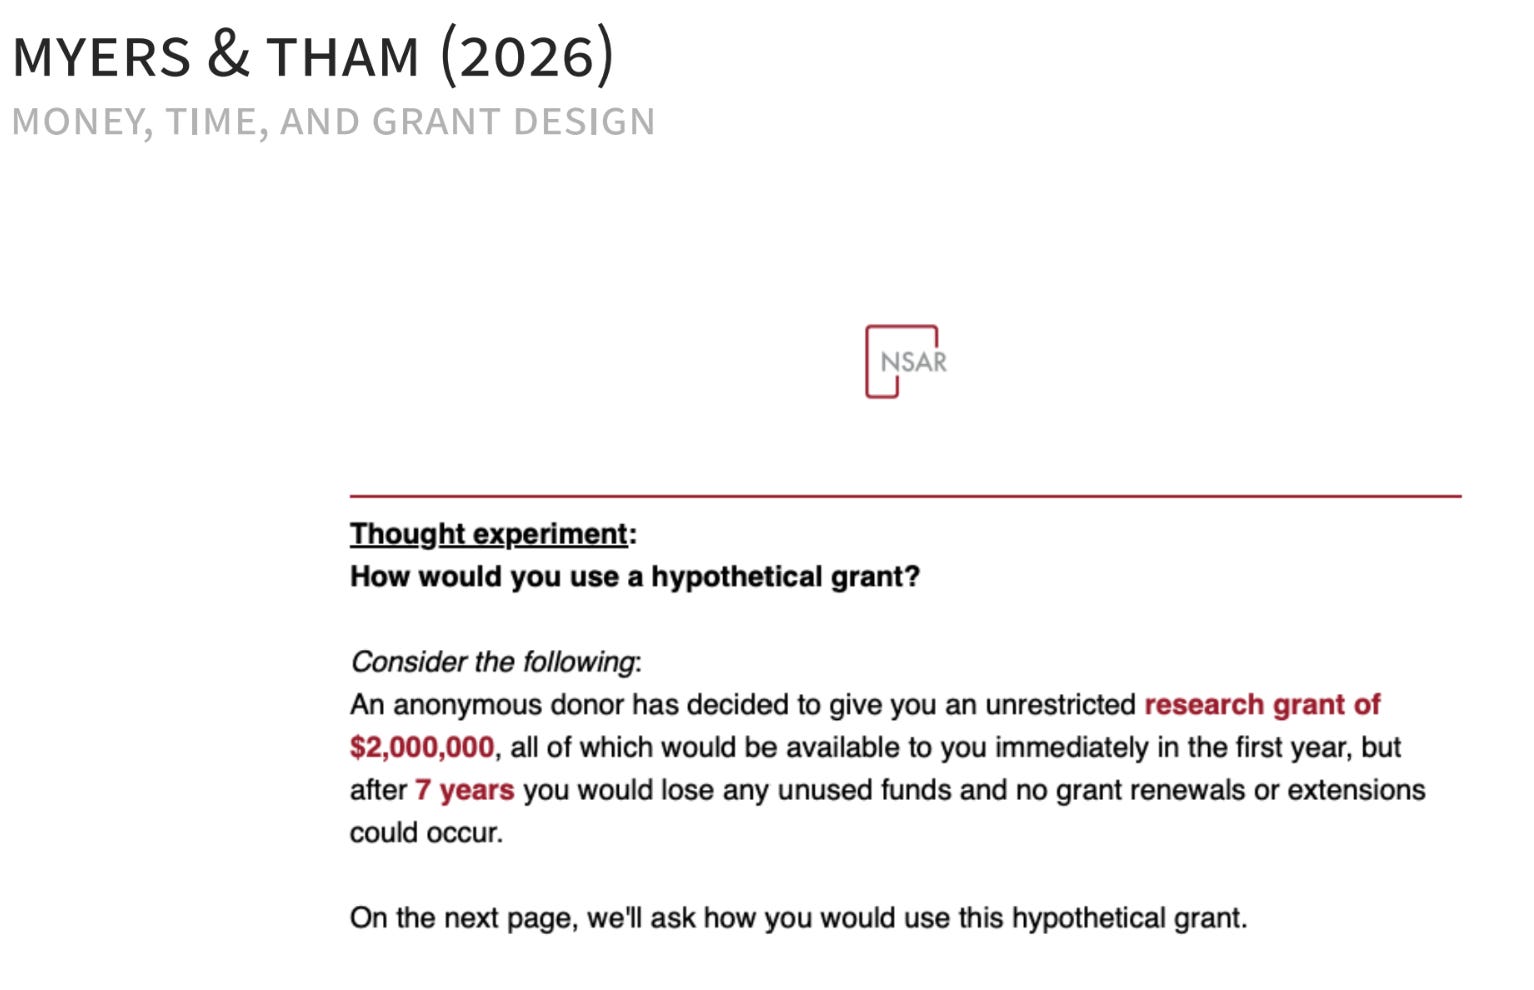
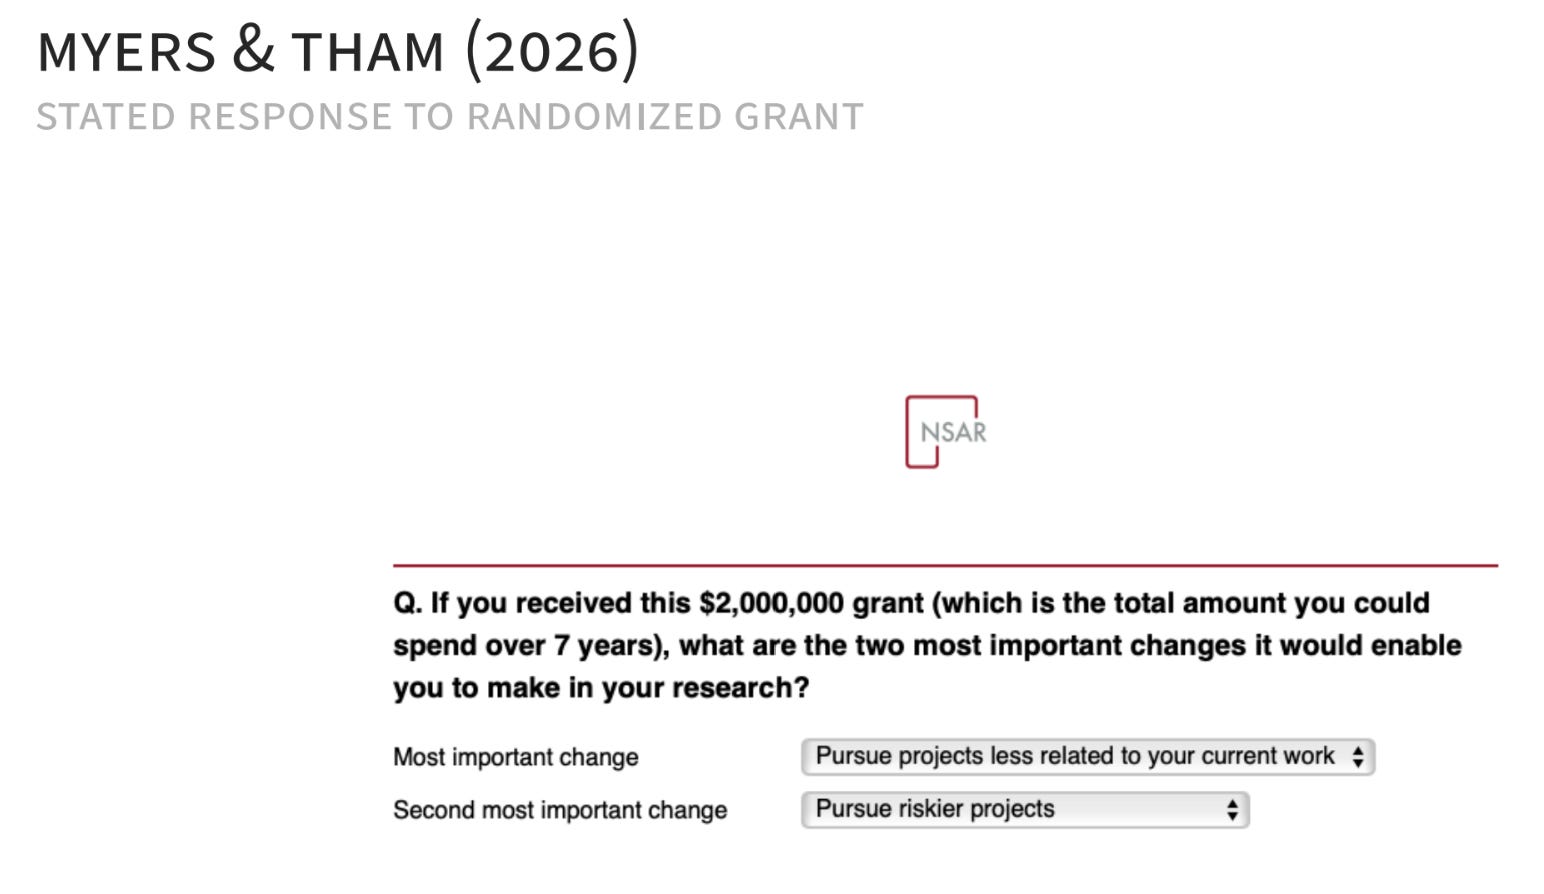
Let’s say you got a grant, and we randomized the amount and the duration of these grants. Then we pretty simply asked them, “What they would do?” and we structured the possible answers to be things that aligned with the different theories about how these different incentives could influence scientists’ strategic choices.
In a certain way, this paper is a bit of a null-effects paper.
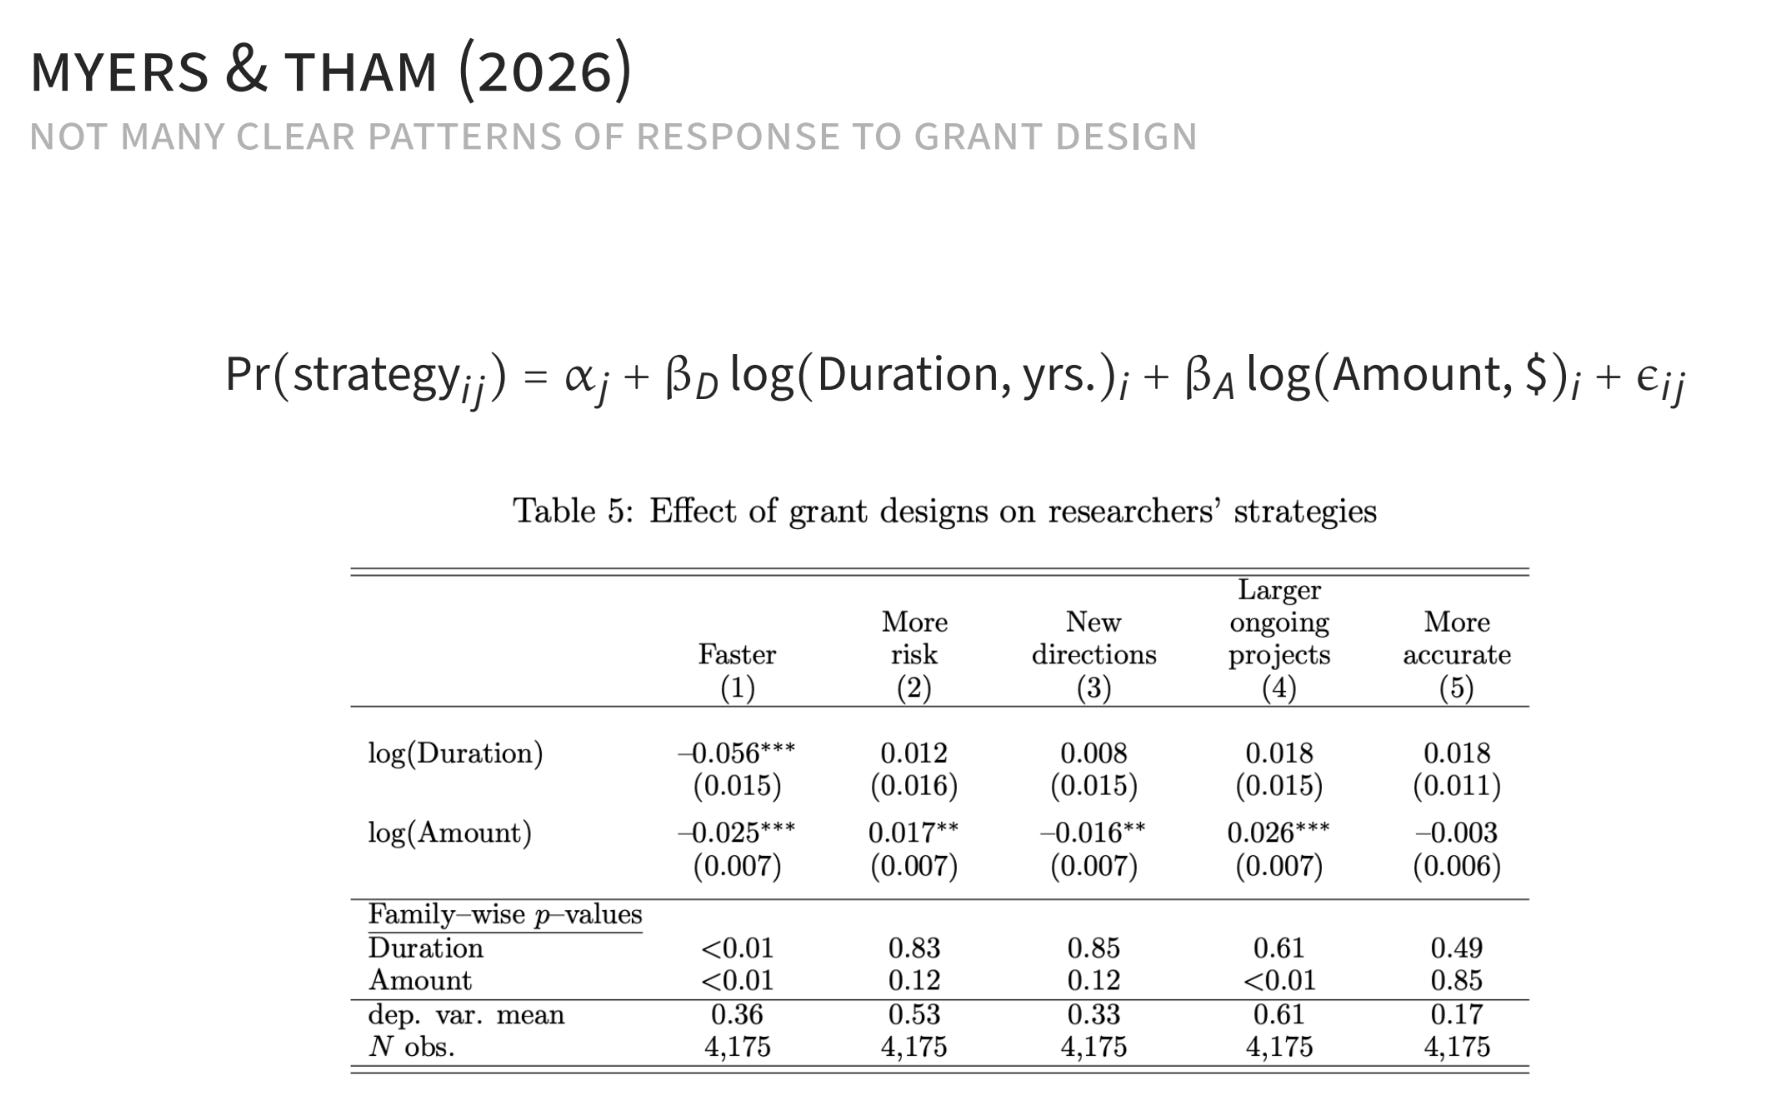
We’ve got our good old-fashioned statistical significance stars there. We see the obvious thing, which is that if we give people longer grants or more money, they’re very unlikely to say they’re going to move fast, which makes a lot of sense and is a bit of a sniff test that they’re taking these things seriously. If we give people more money, they say they’re slightly more likely to say they’ll take more risks. But if we give people longer grants with the same amount of money — that version of the exploration contract — they don’t say that that’s something important in terms of their risk-taking.
We do some work in the paper and we find that actually, if you look at well-resourced post-tenure researchers, when you give them more time, they are willing to take more risks. Those are the kind of people that look a bit more like people in the Pierre, Josh, and Gustavo HHMI paper, where the scientists are awesome scientists already. Whereas we have a very large population. When you zoom in on people, you can probably find some scientists for whom the grant design is a constraint, but on average, one way of thinking about this is that they’re not a large constraint.
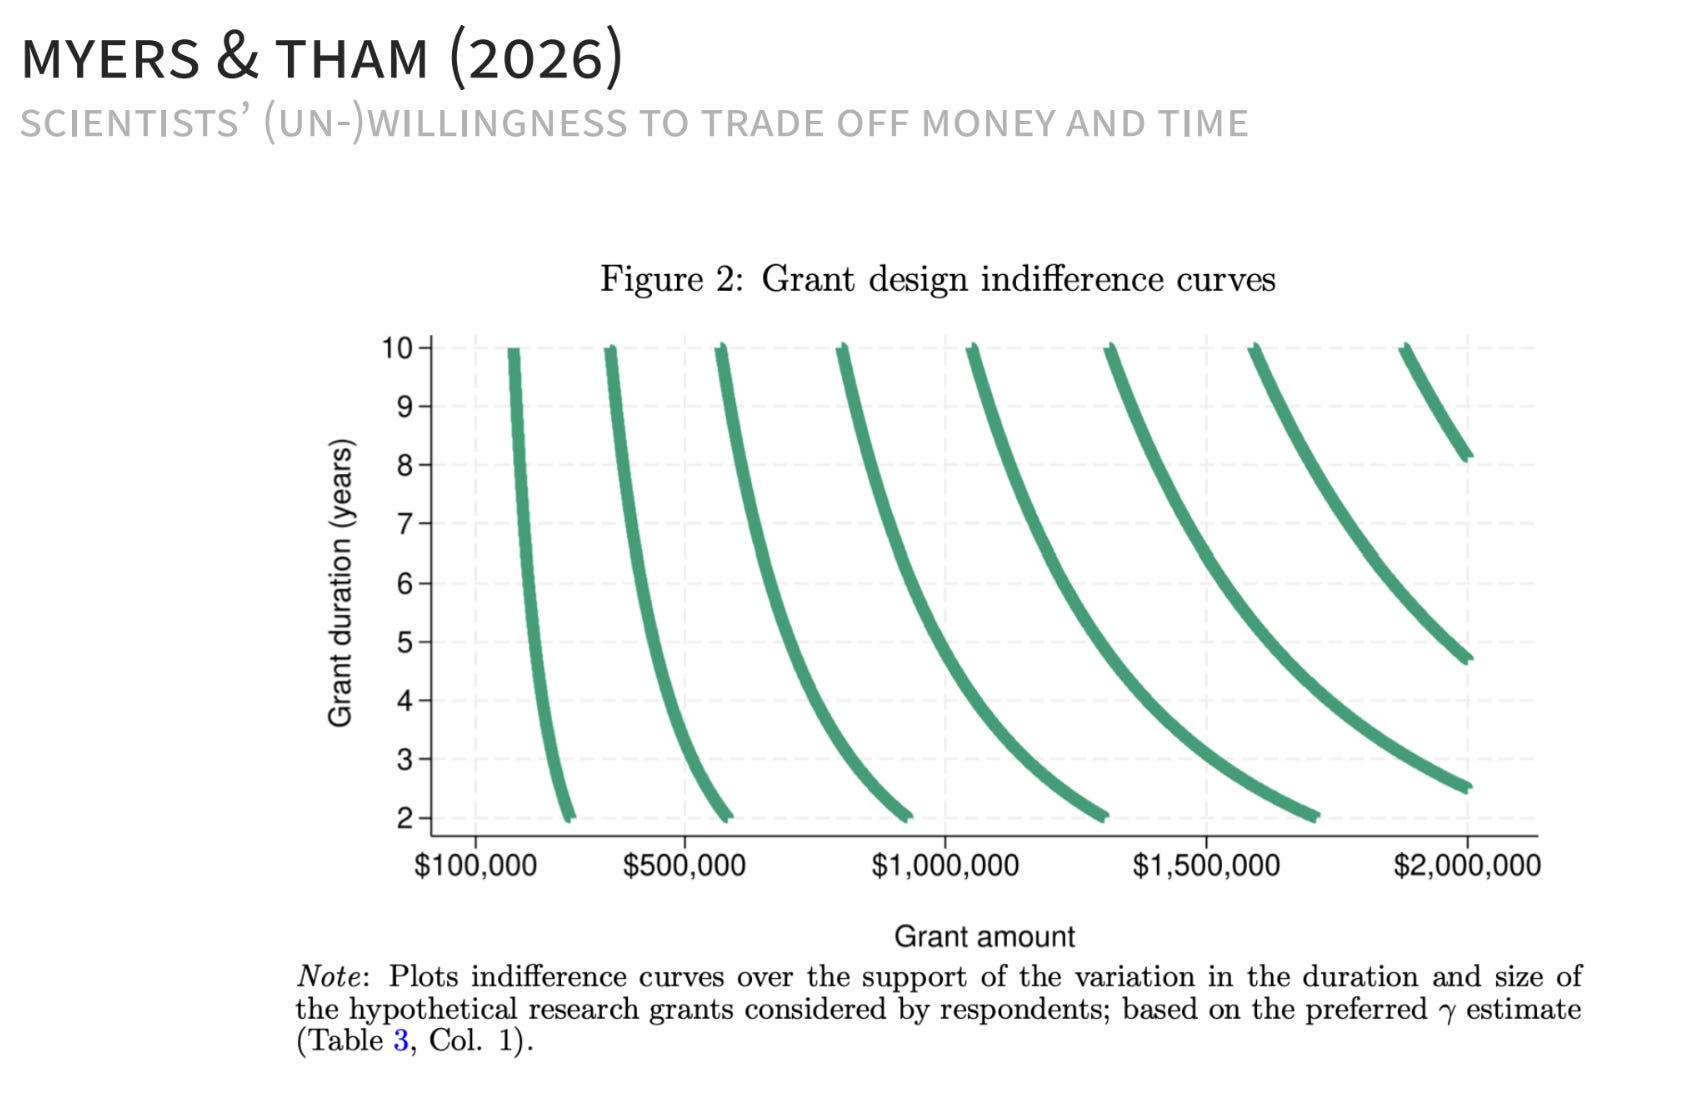
We spent some work in the paper on actually estimating people’s preferences, getting back to the idea that if people have different preferences over the grant designs, then maybe grant design is less about changing what a given scientist does and might be more about changing which scientists show up to your grant door in the first place.
We’re able, with our data, to come up with good old-fashioned indifference curves, where you can say how willing scientists are to trade off dollars versus time.
One of my personal favorite things we do in the paper — you have to buy a lot of assumptions, but you can get an estimate of how willing funders are to make this same trade-off. It looks like funders are much more patient.
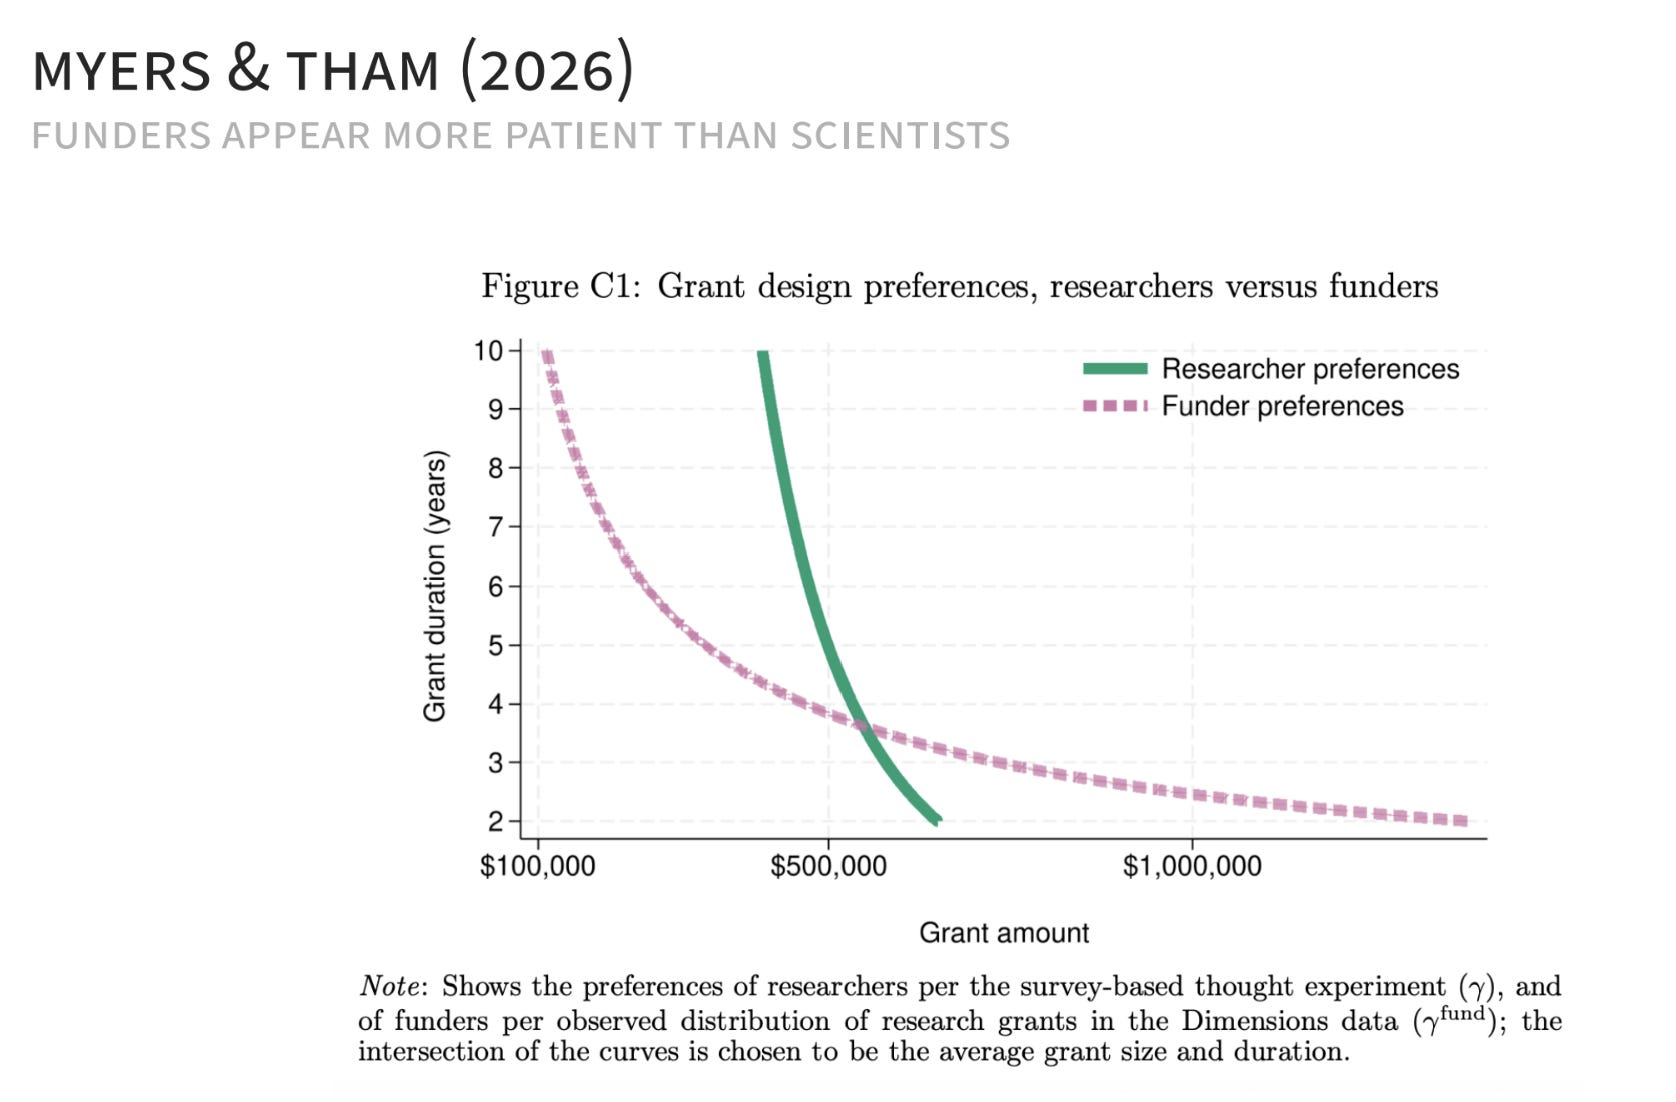
That is to say, if you look at the observed grant design, the trade-off that rationalizes what funders put out in the world makes it look like they’re very willing to trade off time and dollars, whereas scientists basically want the money now. So the constraint on their work is less time and more money.
All the earlier work there was very much focused on dollars and years of grants, and less focused on what happens if we put a funding opportunity on a particular topic. Can we get people to focus on that? That is what I focused on in this paper, The Elasticity of Science. I’m going to jump right to the conclusion, which is this graph.
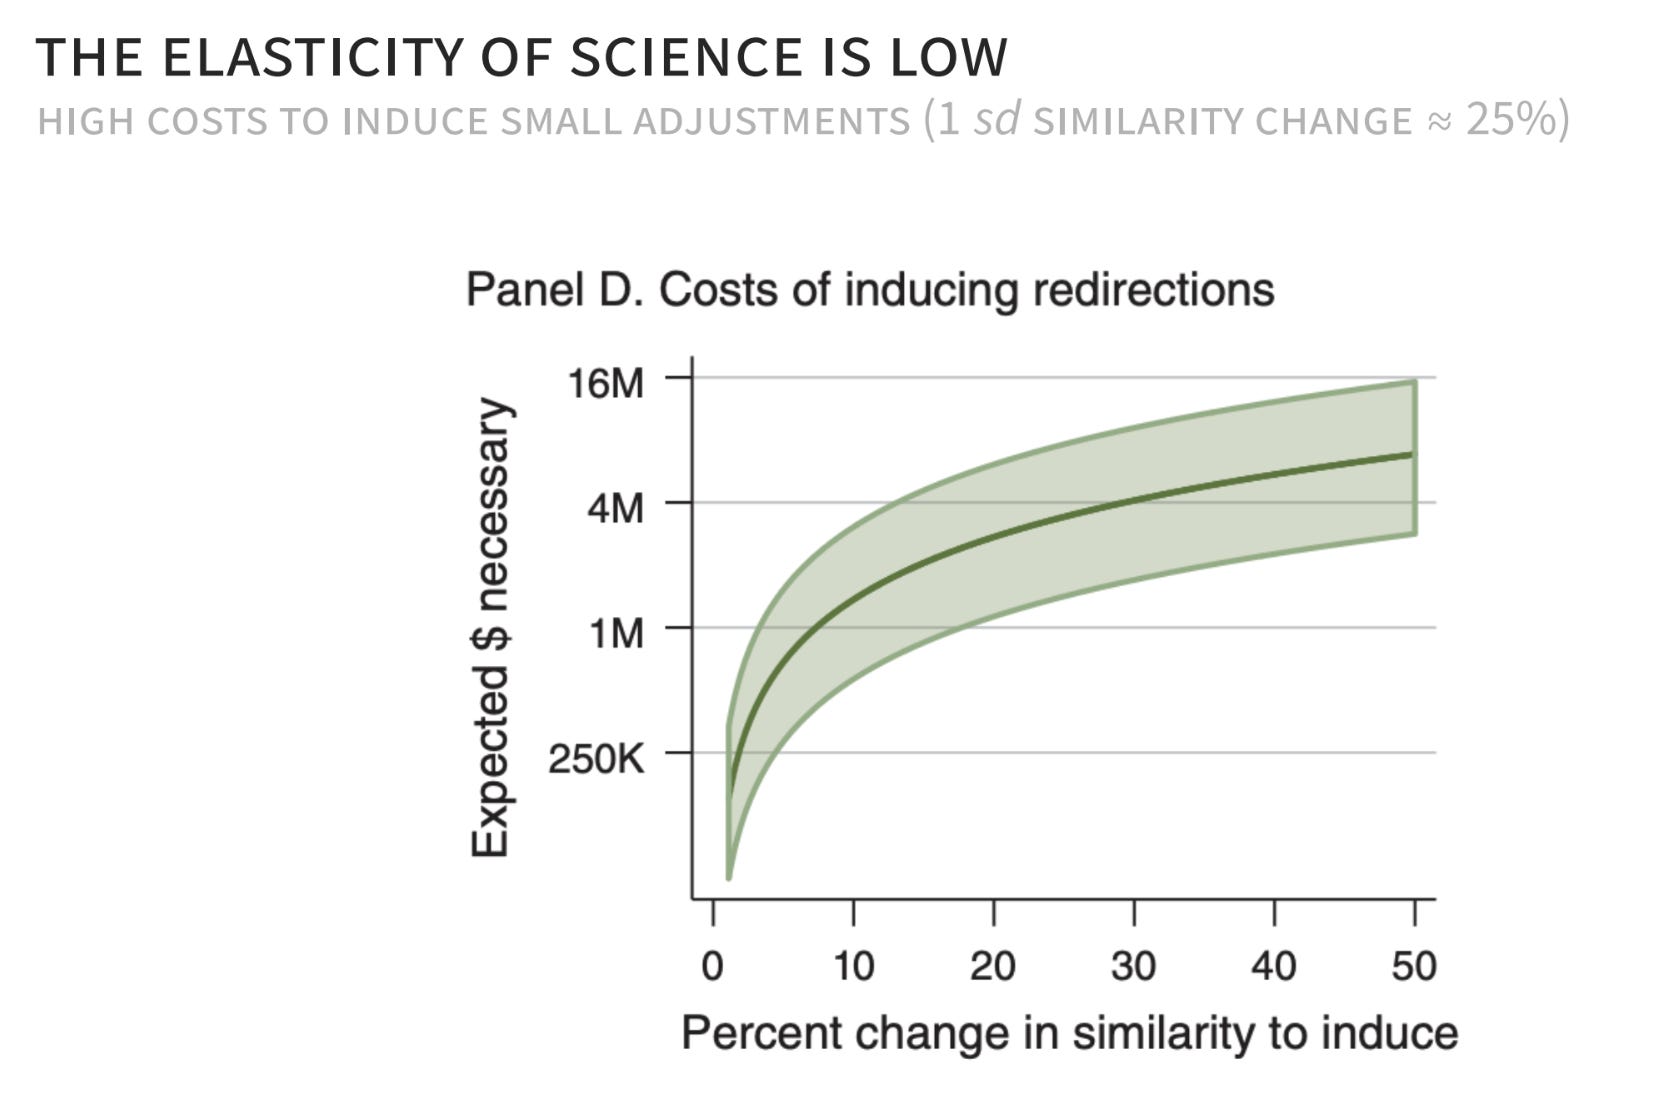
What I’m able to do is say, if I want to move a scientist from point A to point B, and I want to make them make that move only by giving them grant funding, how much money do I have to give them to make that move? That is the elasticity of science I’m focused on in this paper.
This is a graph that says, for every percent change you want to get somebody to make in the direction that they’re pointed with their research, the costs are going to go up pretty quickly. If you look in the data, each researcher, every period, naturally is working on a new topic, and you can think of them as taking a step in a new direction. The standard deviation of steps you see naturally is about 25% of the mean. On average, everybody takes about a 25% difference to their next project. The question is, if I didn’t want to let endogenous natural forces lead people into certain directions, and I just wanted to take money and push them in a particular direction, that would take something like $3-4 million to get them to take a step of the size they naturally take anyway. I would get them to take it in the direction I want, but I would have to pay a pretty hefty price for them to do that.
For reference, the grants at the NIH are on this scale of $3-4 million, and that’s for doing the work of the project that they’ve agreed to already take the step towards. So one very loose way of thinking about this is that if you wanted somebody to do that same amount of work in a different direction, you would have to double the size of the grant. That’s a very casual way of interpreting this, but I think it conveys the magnitudes that I’m finding.
I think this paper was important because a very understandable default assumption for a lot of economic modeling is that adjustment costs are trivial and people can move around, which for certain types of work, especially in most of the 20th century, wasn’t the craziest assumption. Part of what I was trying to convey in this paper is that that is not a good assumption to make in science. It’s very difficult. What drives these costs? It could be that I just don’t want to do it. I’m a scientist and I’m willing to give up a lot of resources to not do that thing you want me to do. Part of it could be that I have a lot of expensive equipment that can only do certain things. There are lots of different reasons there that I haven’t totally unpacked, but the net magnitude is something to take seriously.
Now I want to spend the last bit of time walking through this wonderful paper, A Quest for Knowledge, by Christoph Carnehl and Johannes Schneider, because it’s one of the most interesting theoretical papers in the economics of science that takes direction very seriously as of late. I’m going to try to walk you through these slides in a way that can give you a start of some intuition as to what’s a different way of thinking about what the direction of science even means. Part of the beauty of this paper is it gives you a framework for how to think about what it means, in mathematical terms, to think about the direction of science.
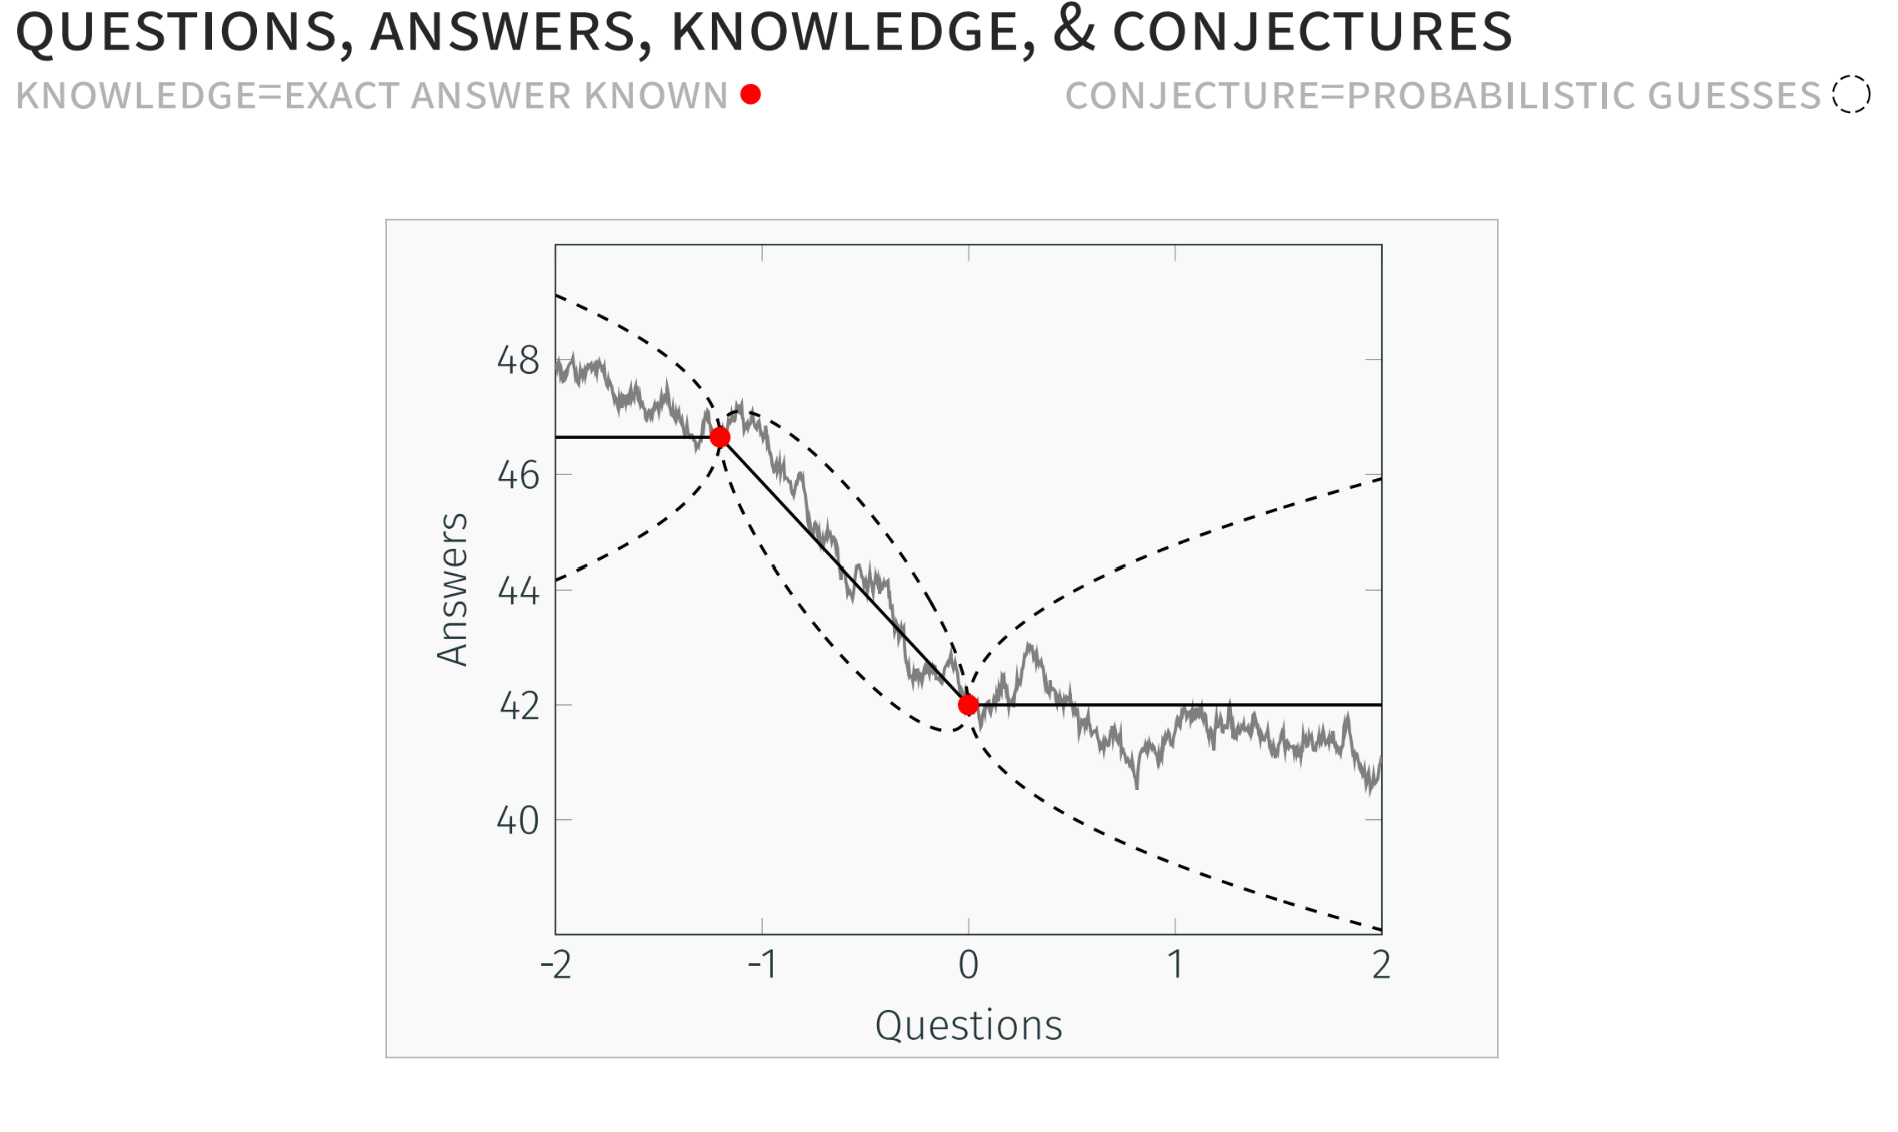
What they do is, first, say there are truths about the world, and those truths are answers to questions. Let’s assume that we can line up every question on some arbitrary scale, and the answers to all of those questions are some number, and the path of that number is this jaggedy — the Brownian motion, that sounds very intimidating, but it’s this messy gray line that is the truth of the universe.
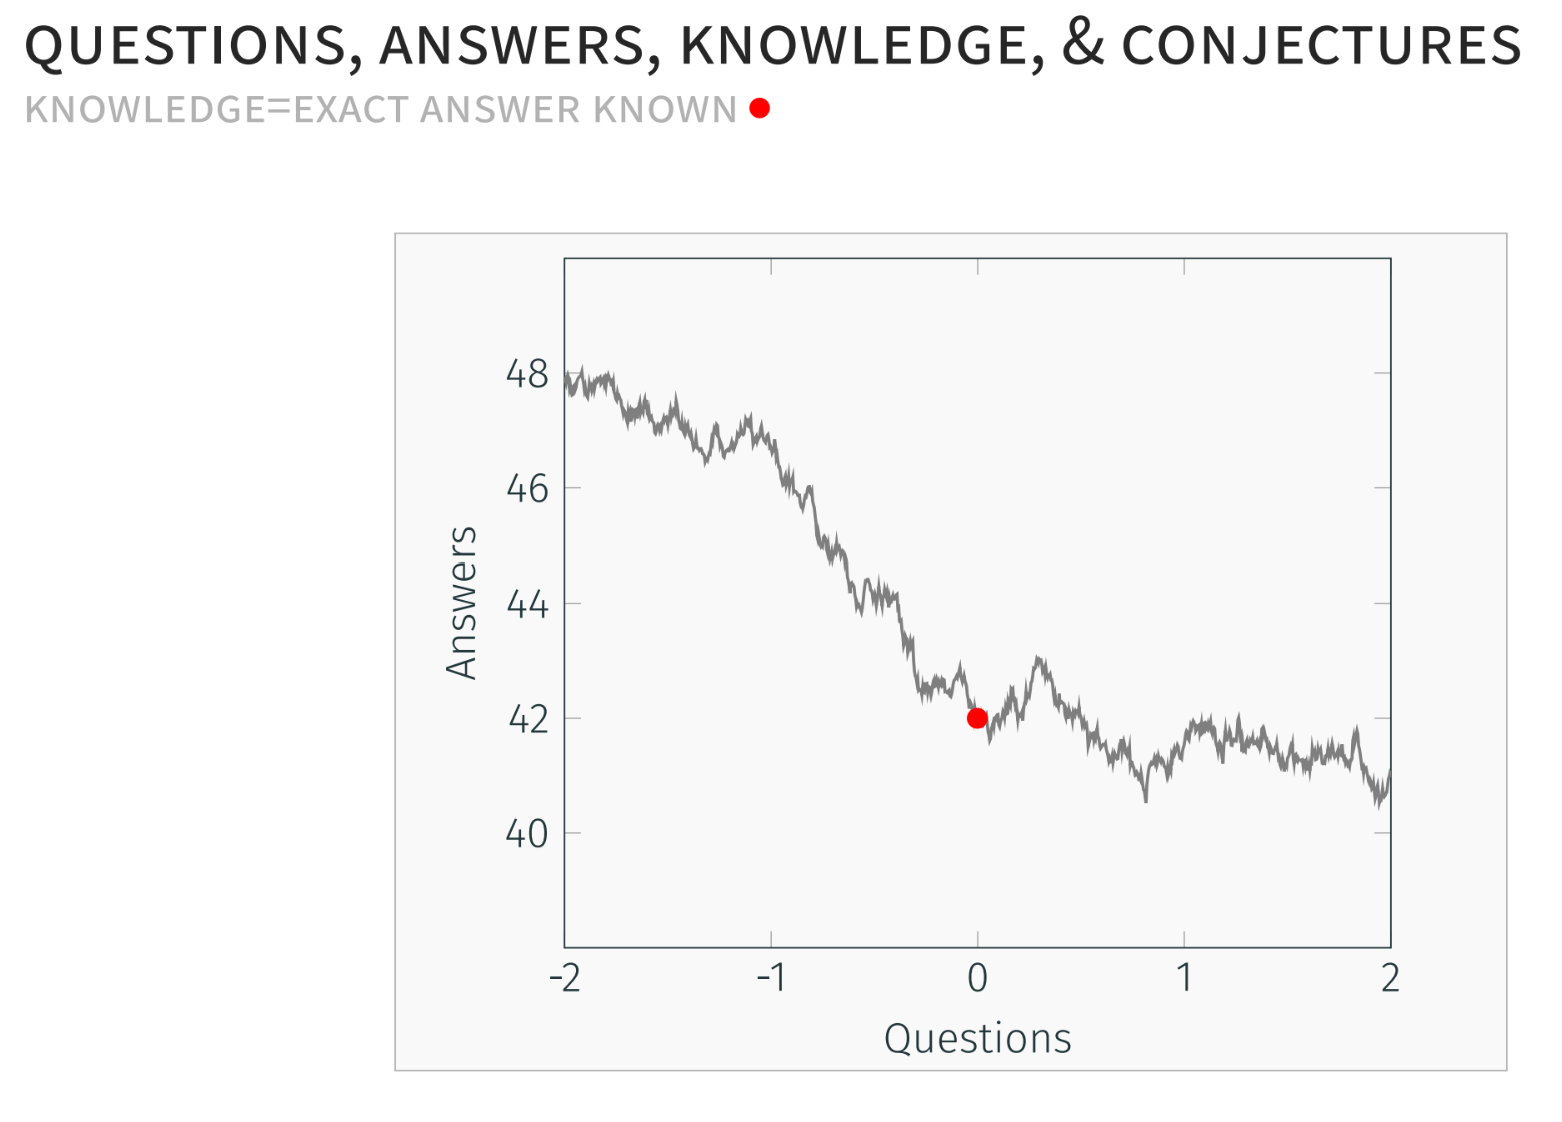
Now, what is knowledge? Knowledge is a point on that line where we know the answer to that question. That’s my red dot here. We know that the answer to Question 0 is 42. It’s nice to put mathematics on this; it sounds silly saying it, but this could be, “How hot do you have to get a PCR machine to adequately produce the right number of copies of the genome?” It’s 42 degrees. That’s the kind of thing we’re talking about here.
Then they bring in the very realistic thing — knowing this point exactly gives us more information than just that point. Since we know there’s some structure to the knowledge of the universe, we can make a conjecture about the answers to the questions around the question that we know the answer to.
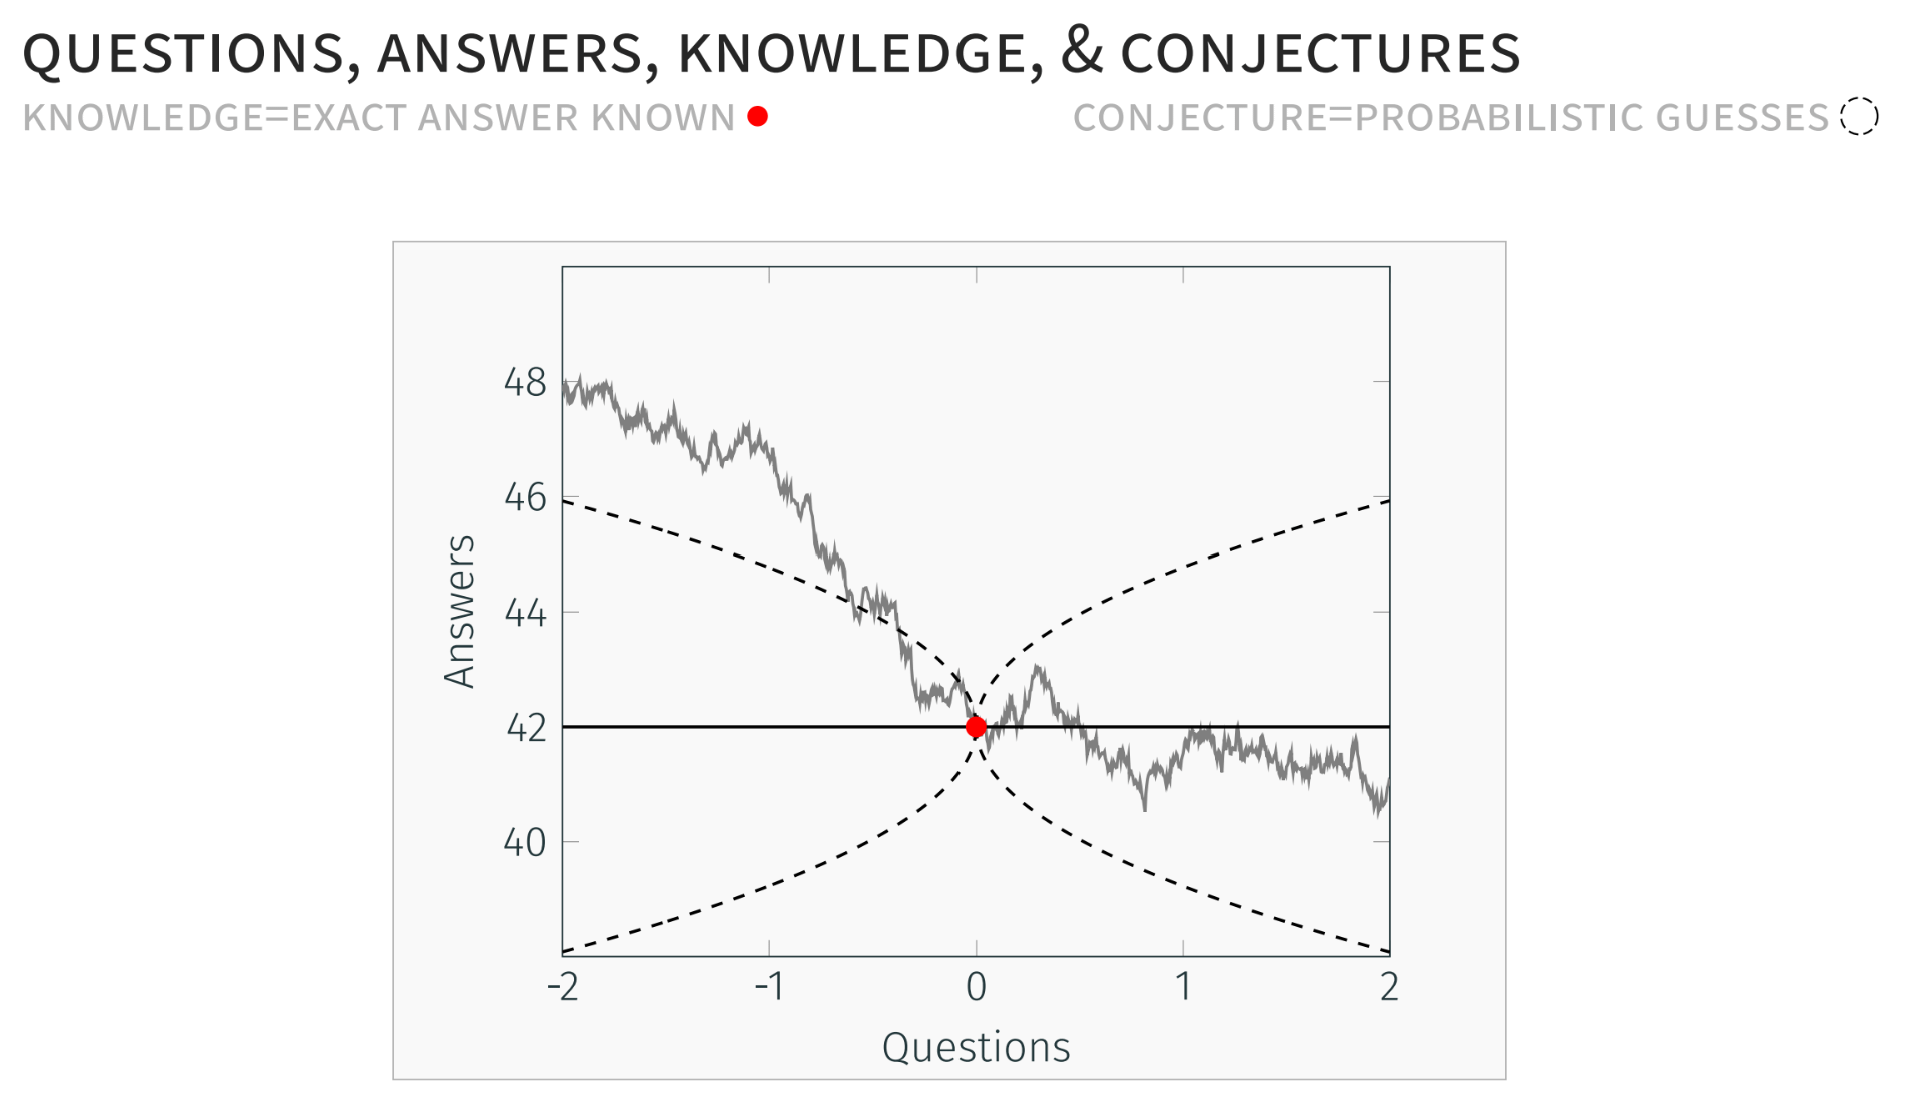
You could think of these as probabilistic guesses. We don’t know exactly what the answer to Question -1 is, but we are pretty confident that if the answer to Question 0 is 42, the answer to Question -1 is somewhere between 46 and 38. In this case we’re wrong, as you can see, because we can see the truth, but that is our best guess given what we know. What happens if we learn the answer to Question -1.5?
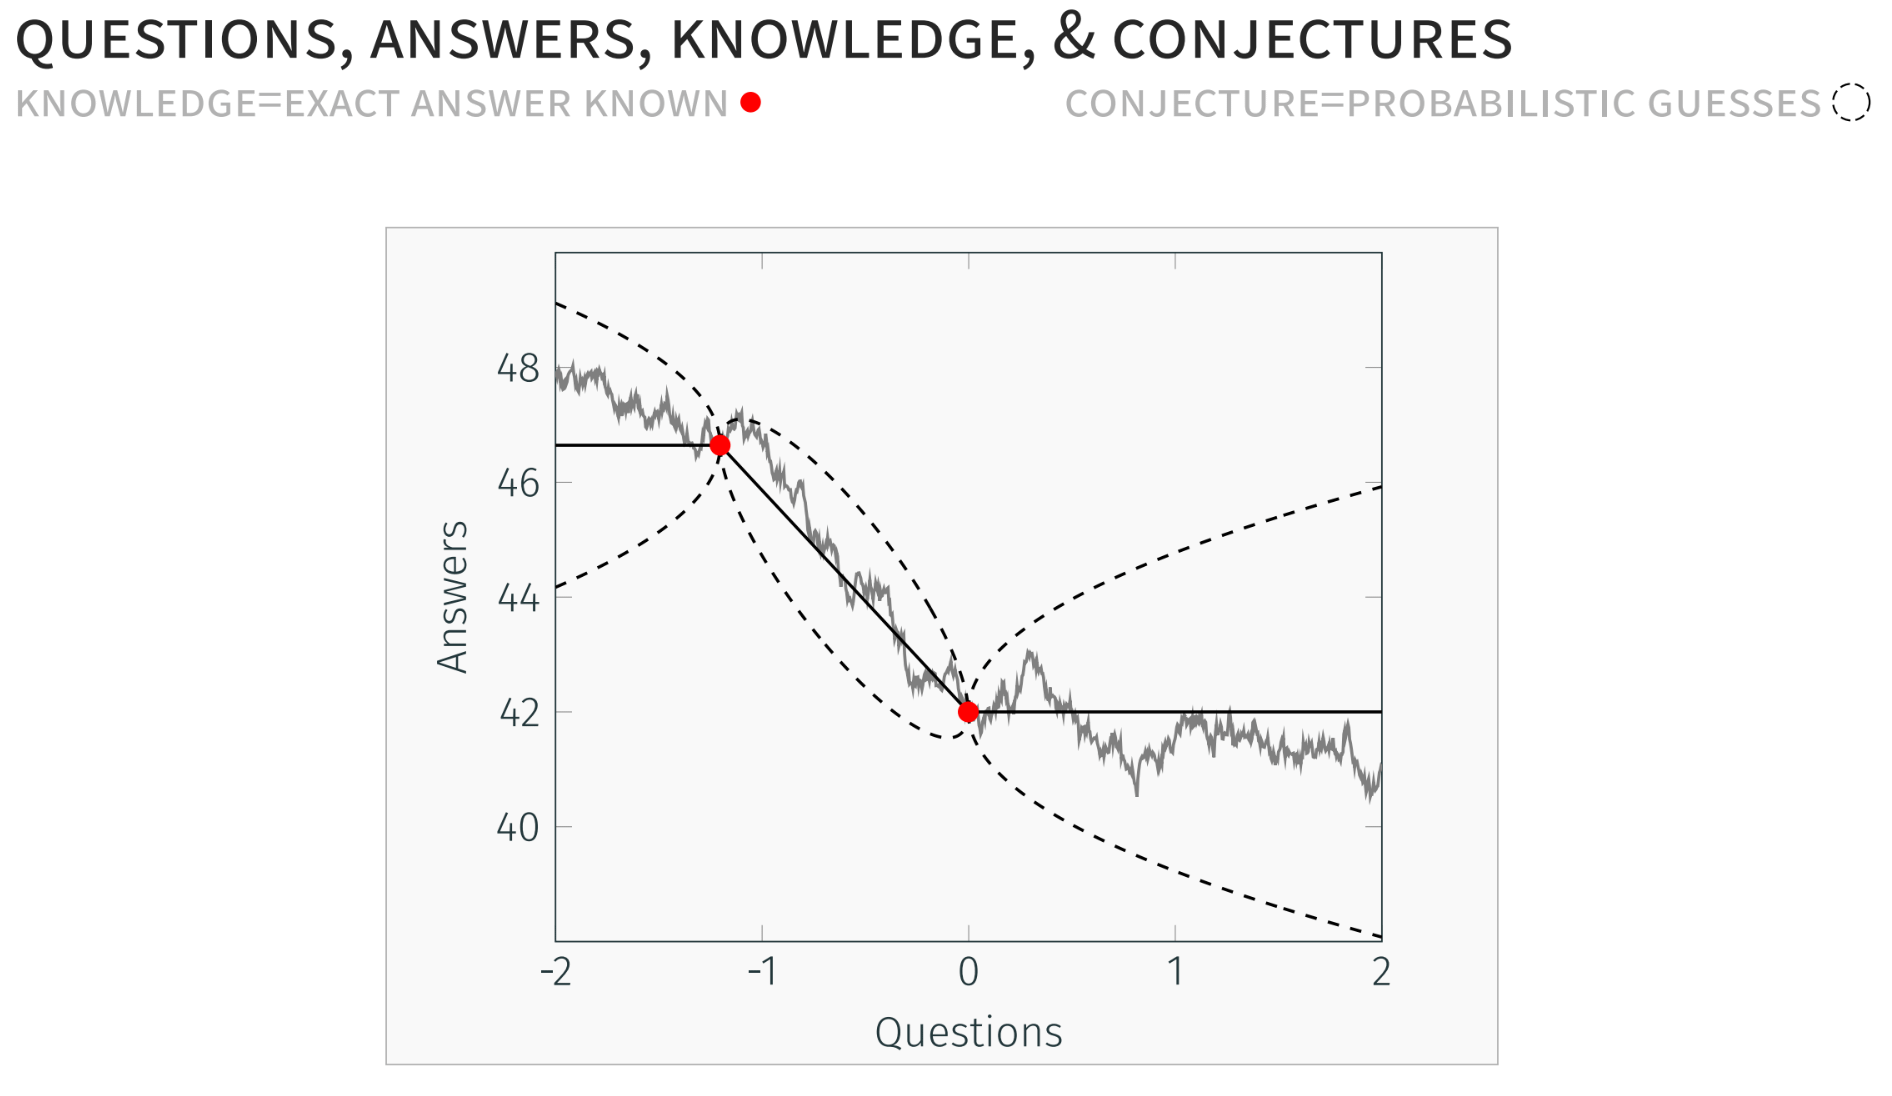
That buys us our nice red dot up there, and it really shrinks the uncertainty around the truth in between the two questions we know the answer to.
Thinking of the world this way opens up a nice way of thinking about what the optimal direction of science should look like. It formulates it as a very specific thing in terms of where on this question number line we should try to answer the next question.
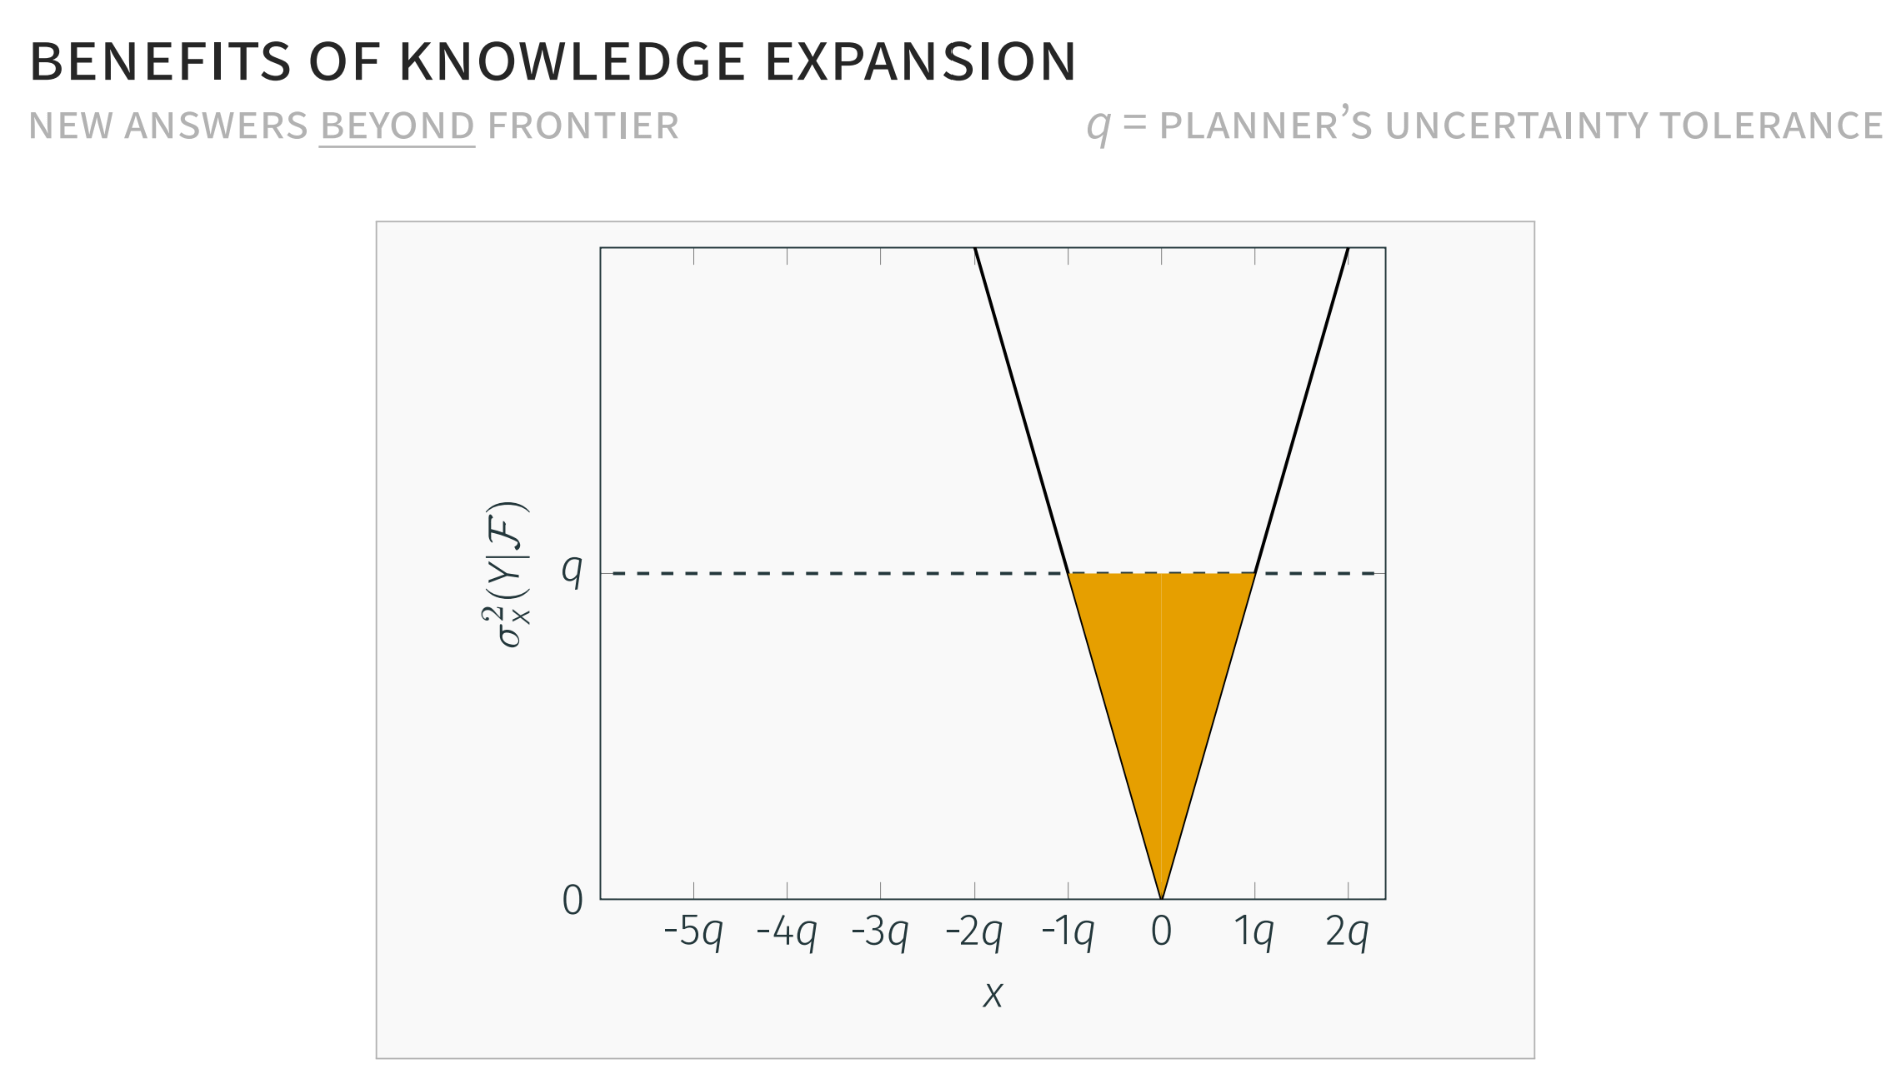
The way that Christoph is doing this graphically is: let’s go back and say, our x-axis is still our question line, and we know the answer to 0. Now I’ve scaled this by Q. Q is the thing that determines the planner’s uncertainty tolerance. If Q is very low, that means that as the planner — when we’re making decisions about things based on conjectures — we really want to know that what we’re going to do in the world, based on our guess of the answer to the question, we are going to be sure. If we really need to be sure, then we’re really going to be talking about projects taking very small steps in question space. Since we’re very risk-averse, we want to only think about taking very small steps, because the value of information is very high. If we’re very risk-tolerant, then we can jump around on our question number line a lot.
The y-axis — just think of that as the value of knowing the answer to that question. That’s what that triangle is. Don’t worry about the fancy math. That’s the value to society from knowing the answer to Question 0. The question is, where do we go next? Let’s go to -2Q.
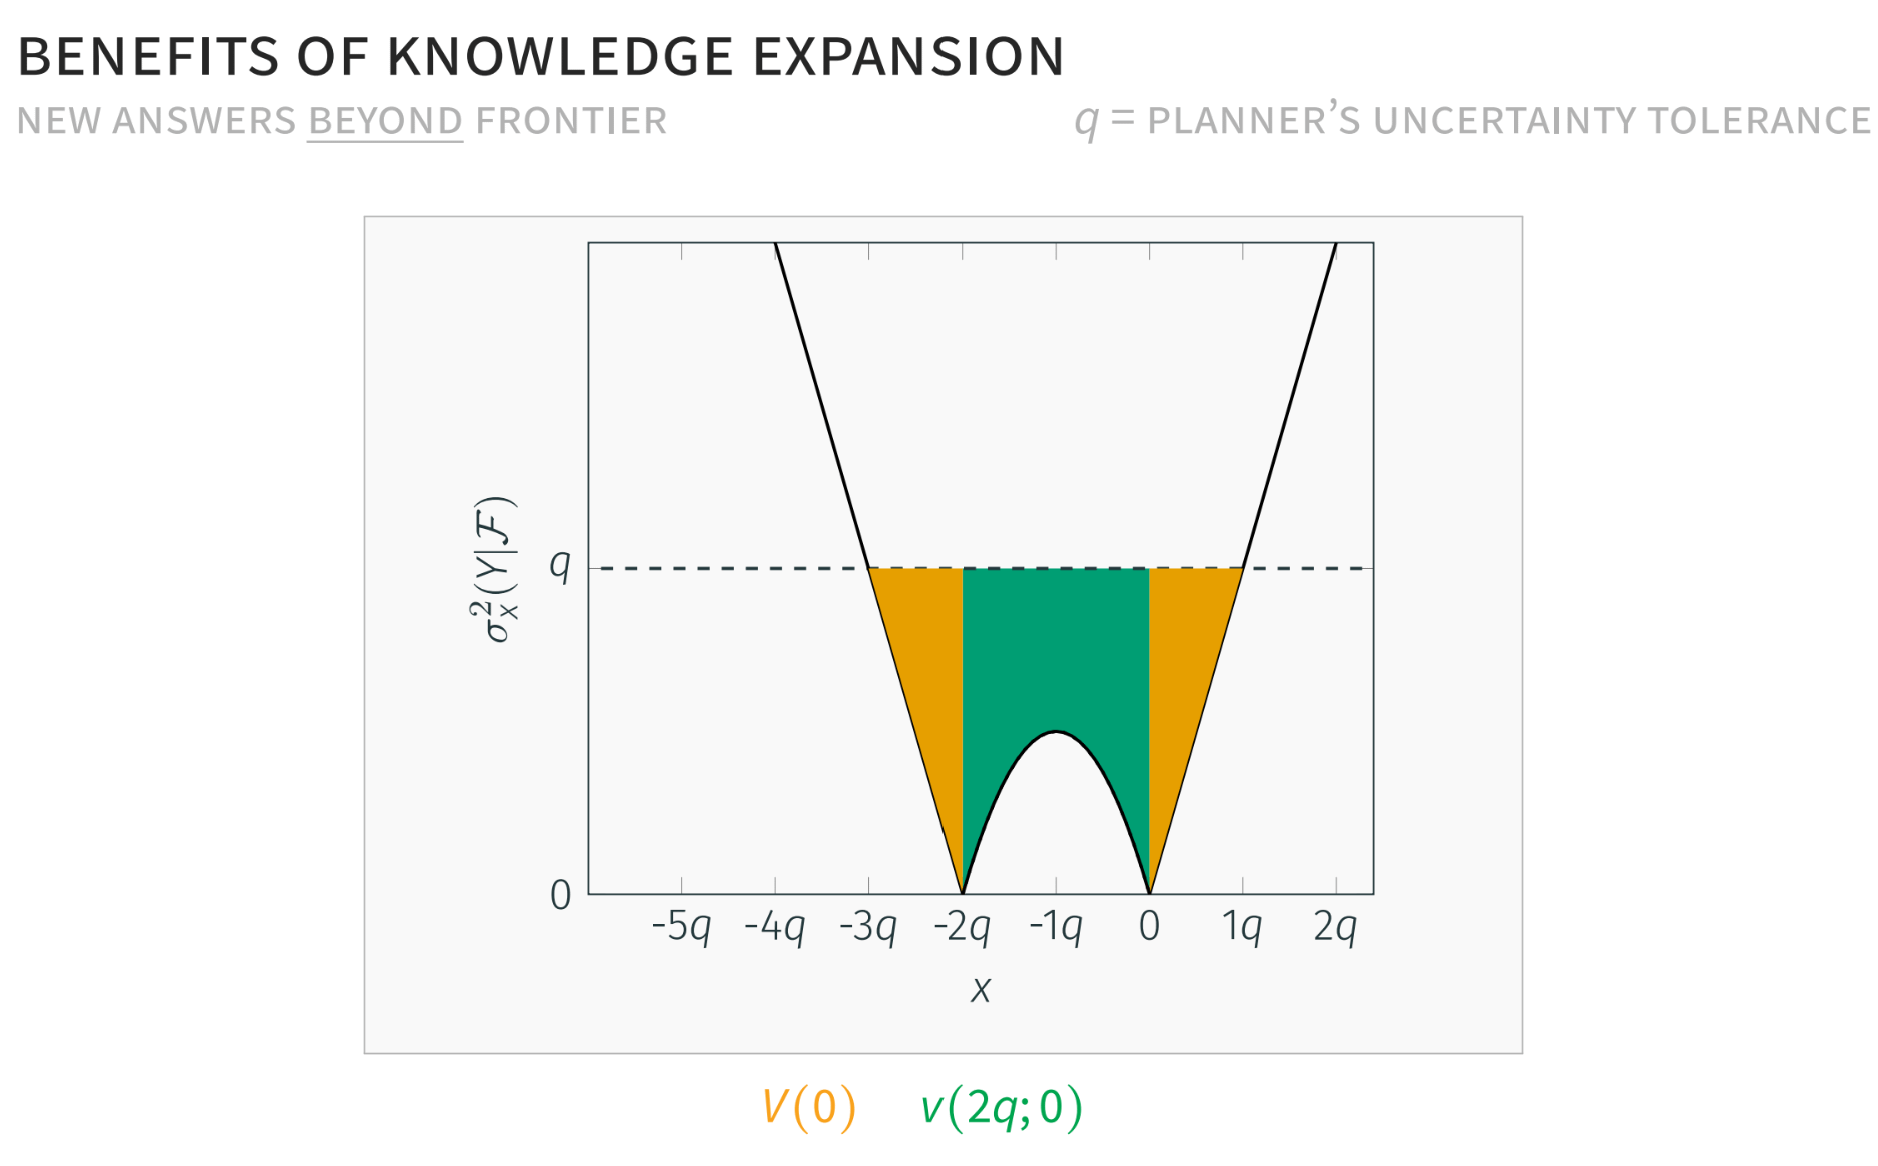
What does -2Q buy us? It buys us that green space, the marginal value of answering that question. Why does it look like this? This little curvature is based on that curvature you’re seeing in between these two known questions.
We get some value because we now have more certainty; our conjectures are better about questions that are in between the two questions we know the answer to. This peak is because right in the middle is where we have the least amount of certainty. Our conjectures are the worst, which is why we cut out that value the most in the middle. The only thing we have full value for is these two things we know the actual answers to. That’s why it goes all the way down to zero there.
We could go to -2Q. That sounds like a good idea. That gets us some value. We could go to -3Q.
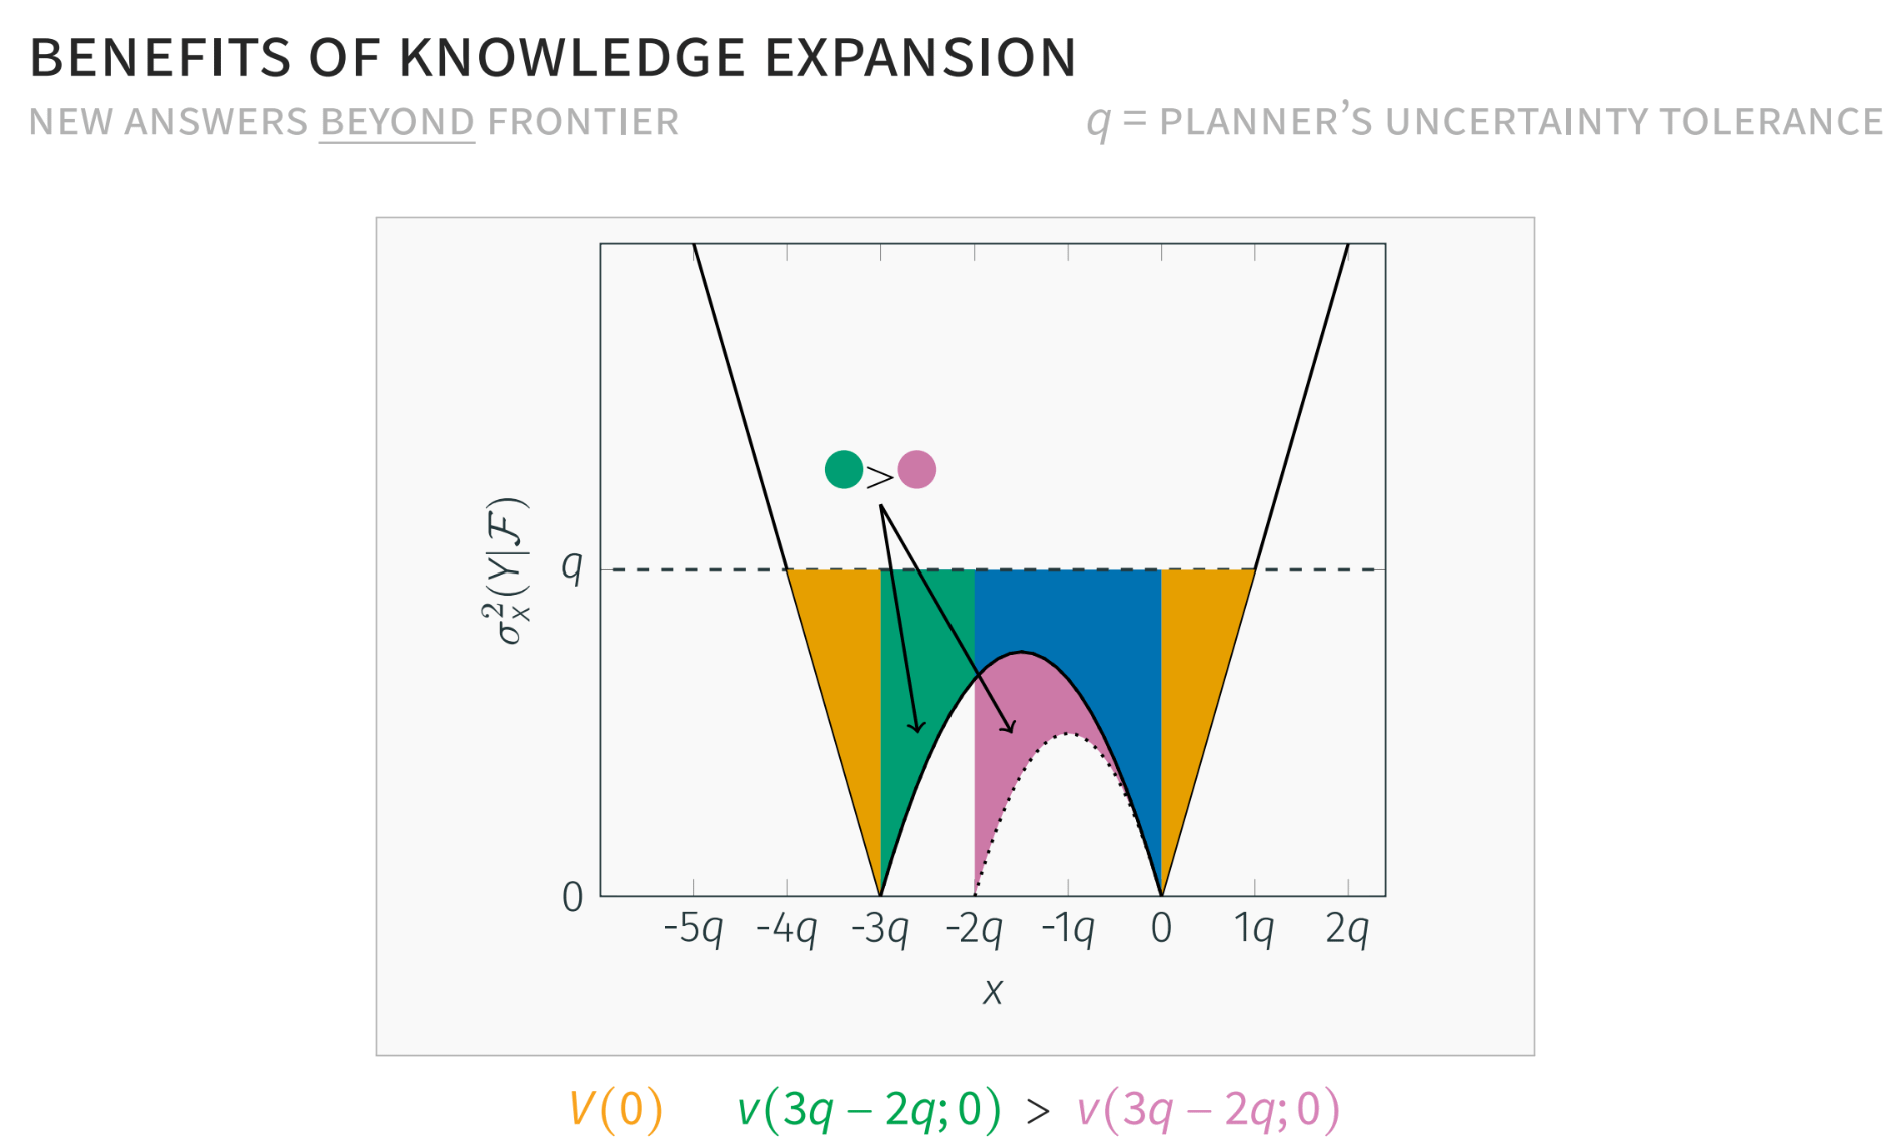
What’s the value of going to -3Q compared to going just to -2Q? Calculus takes you all the way. This is a really nice graphical way of showing that the marginal value of jumping all the way out to -3 is worth more than jumping out to -2. You just take the area of these two things and see how much value is created. It’s a bigger jump. You can see we have more uncertainty; we’ve carved out more of our value by taking that bigger jump, but we’ve bought ourselves more knowledge closer towards that new question.
Let’s keep going.
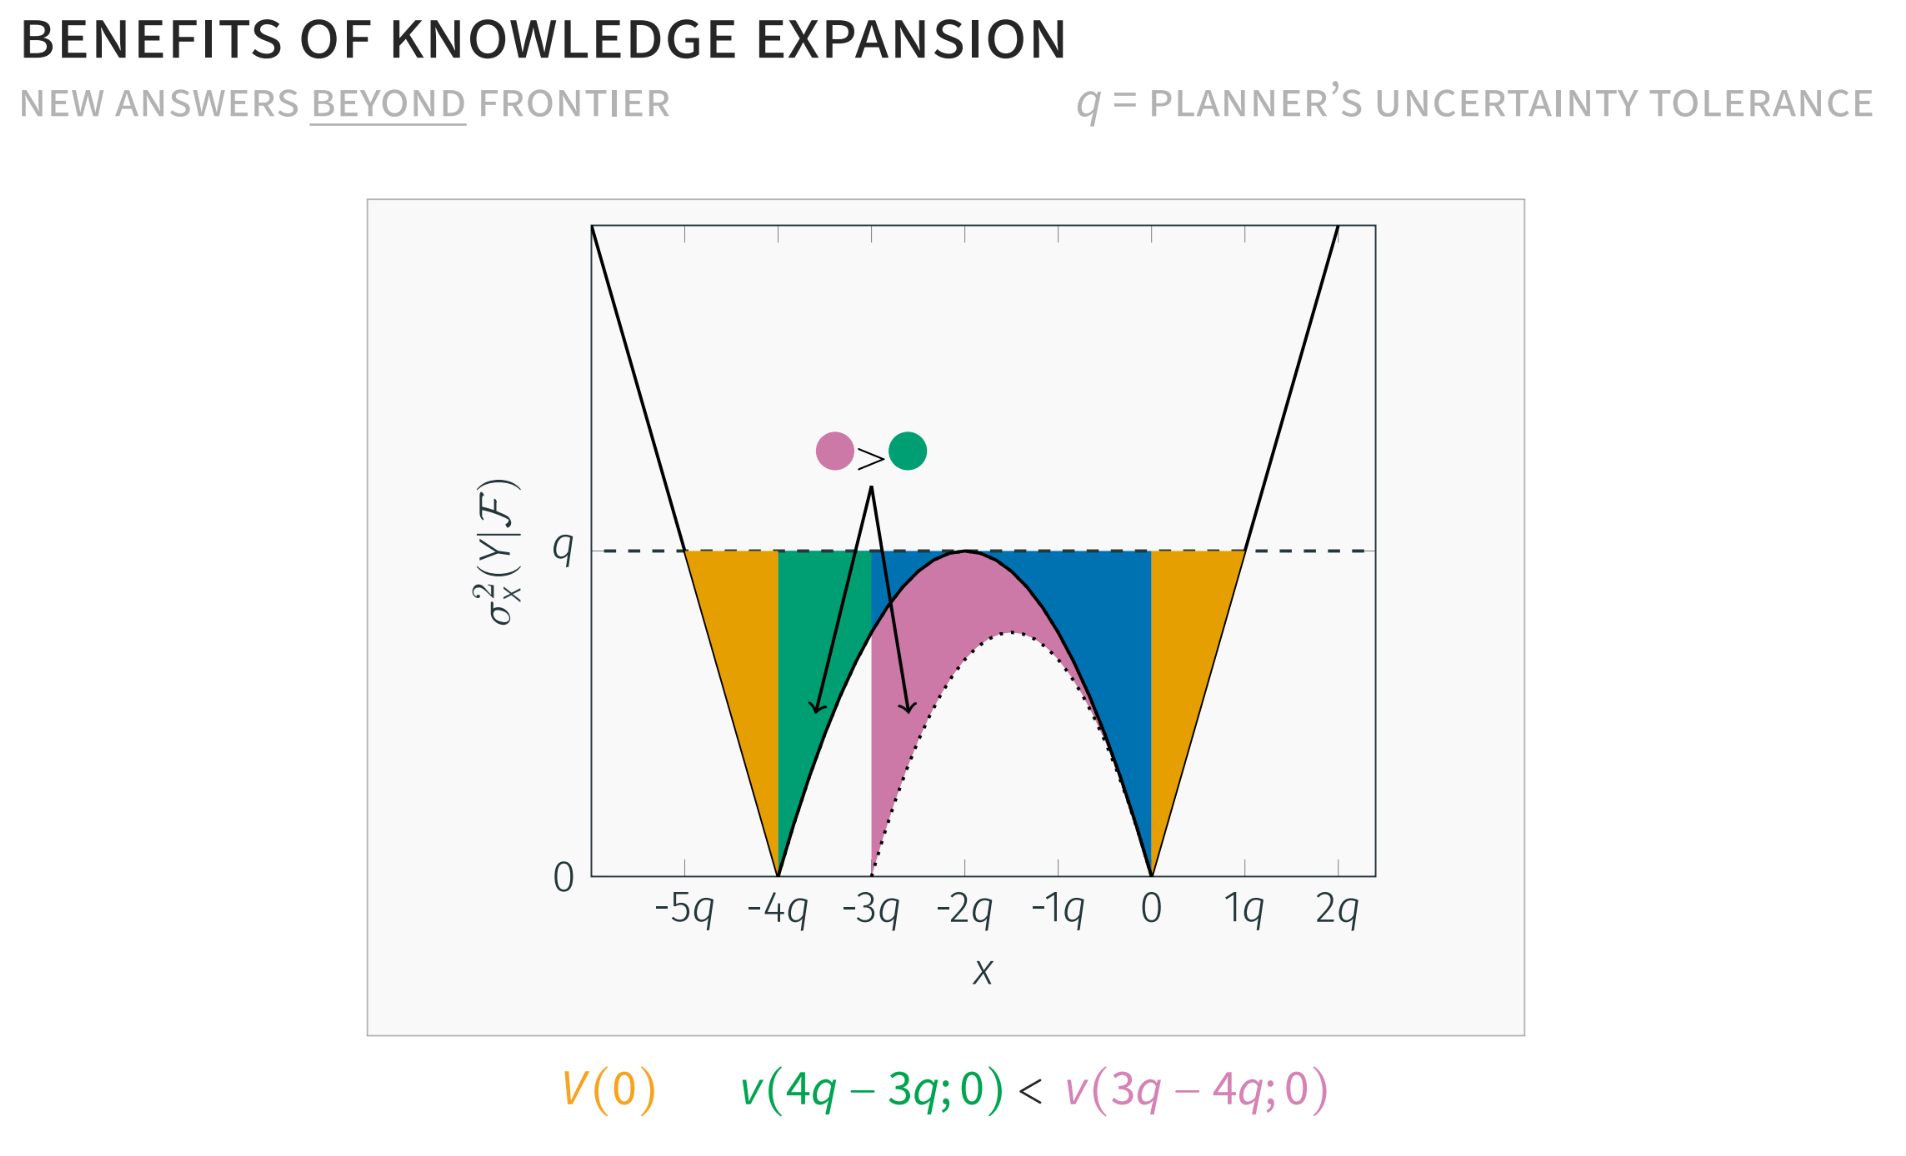
Well, no, because eventually you’re going to take a leap that’s so big that the uncertainty resolved in between your two answers does not actually buy you much. You can see in this area, going to -4 actually is not as helpful, because this marginal value of just going to -3 is a bigger chunk of value than going all the way out. The idea is, if we know the answer to this question and we shoot for answering a question that’s super far out, that’ll help us super far out there, but that does nothing to help us learn about what’s going on in between those two points.
Hopefully this is starting to give you intuition that the value of picking new directions is what it buys you in between things we already know, which also means that pushing the frontier can mean pursuing questions in between questions we already know.
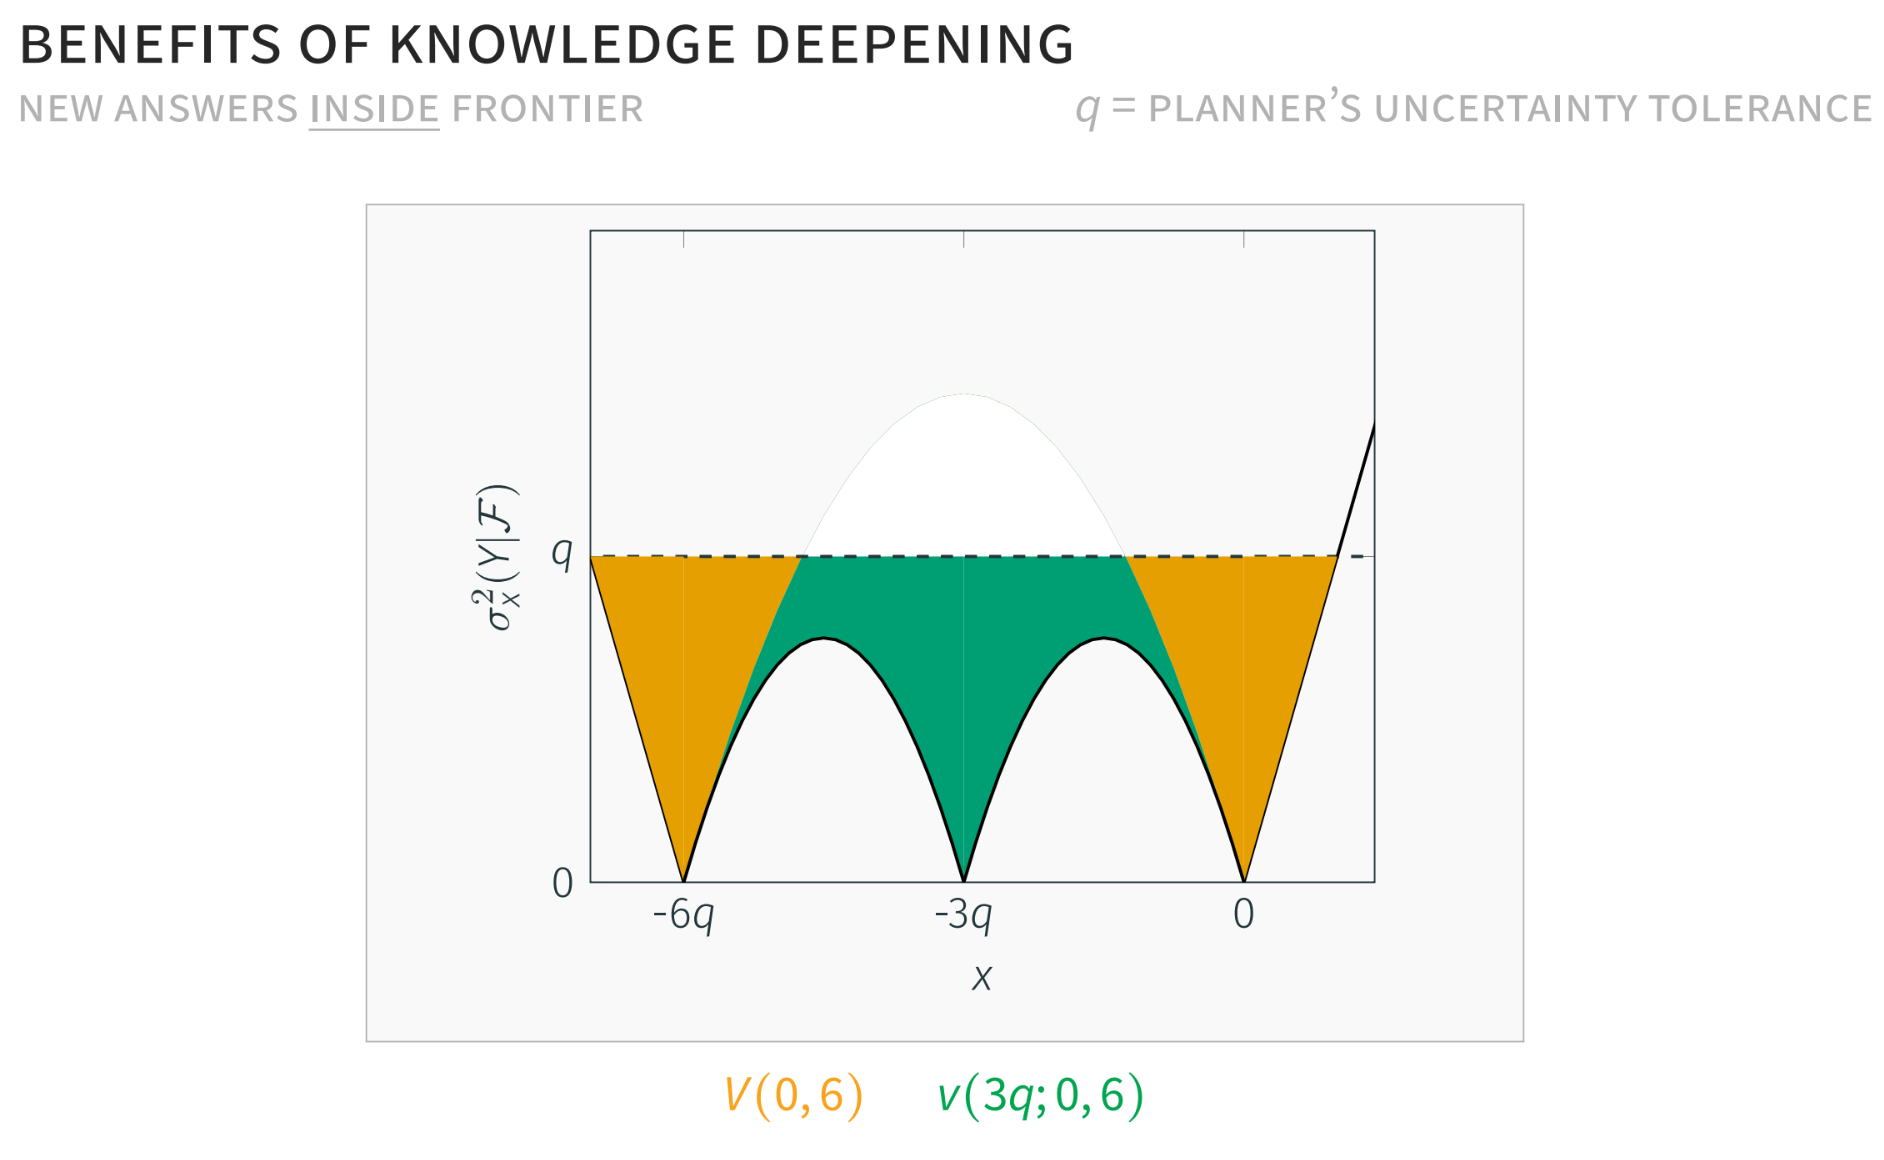
In this case, let’s say we actually know 0 and we also know -6. Where do we go from here? You can see value can be created by shooting for Question -3 in the middle, because that’s resolving a lot of uncertainty about what’s going on in between zero and -6. In this setup, it’s optimal to shoot for the dead middle spot, because that’s where the most value is created. But this is where math is tricky and complicated: it’s not always the case.
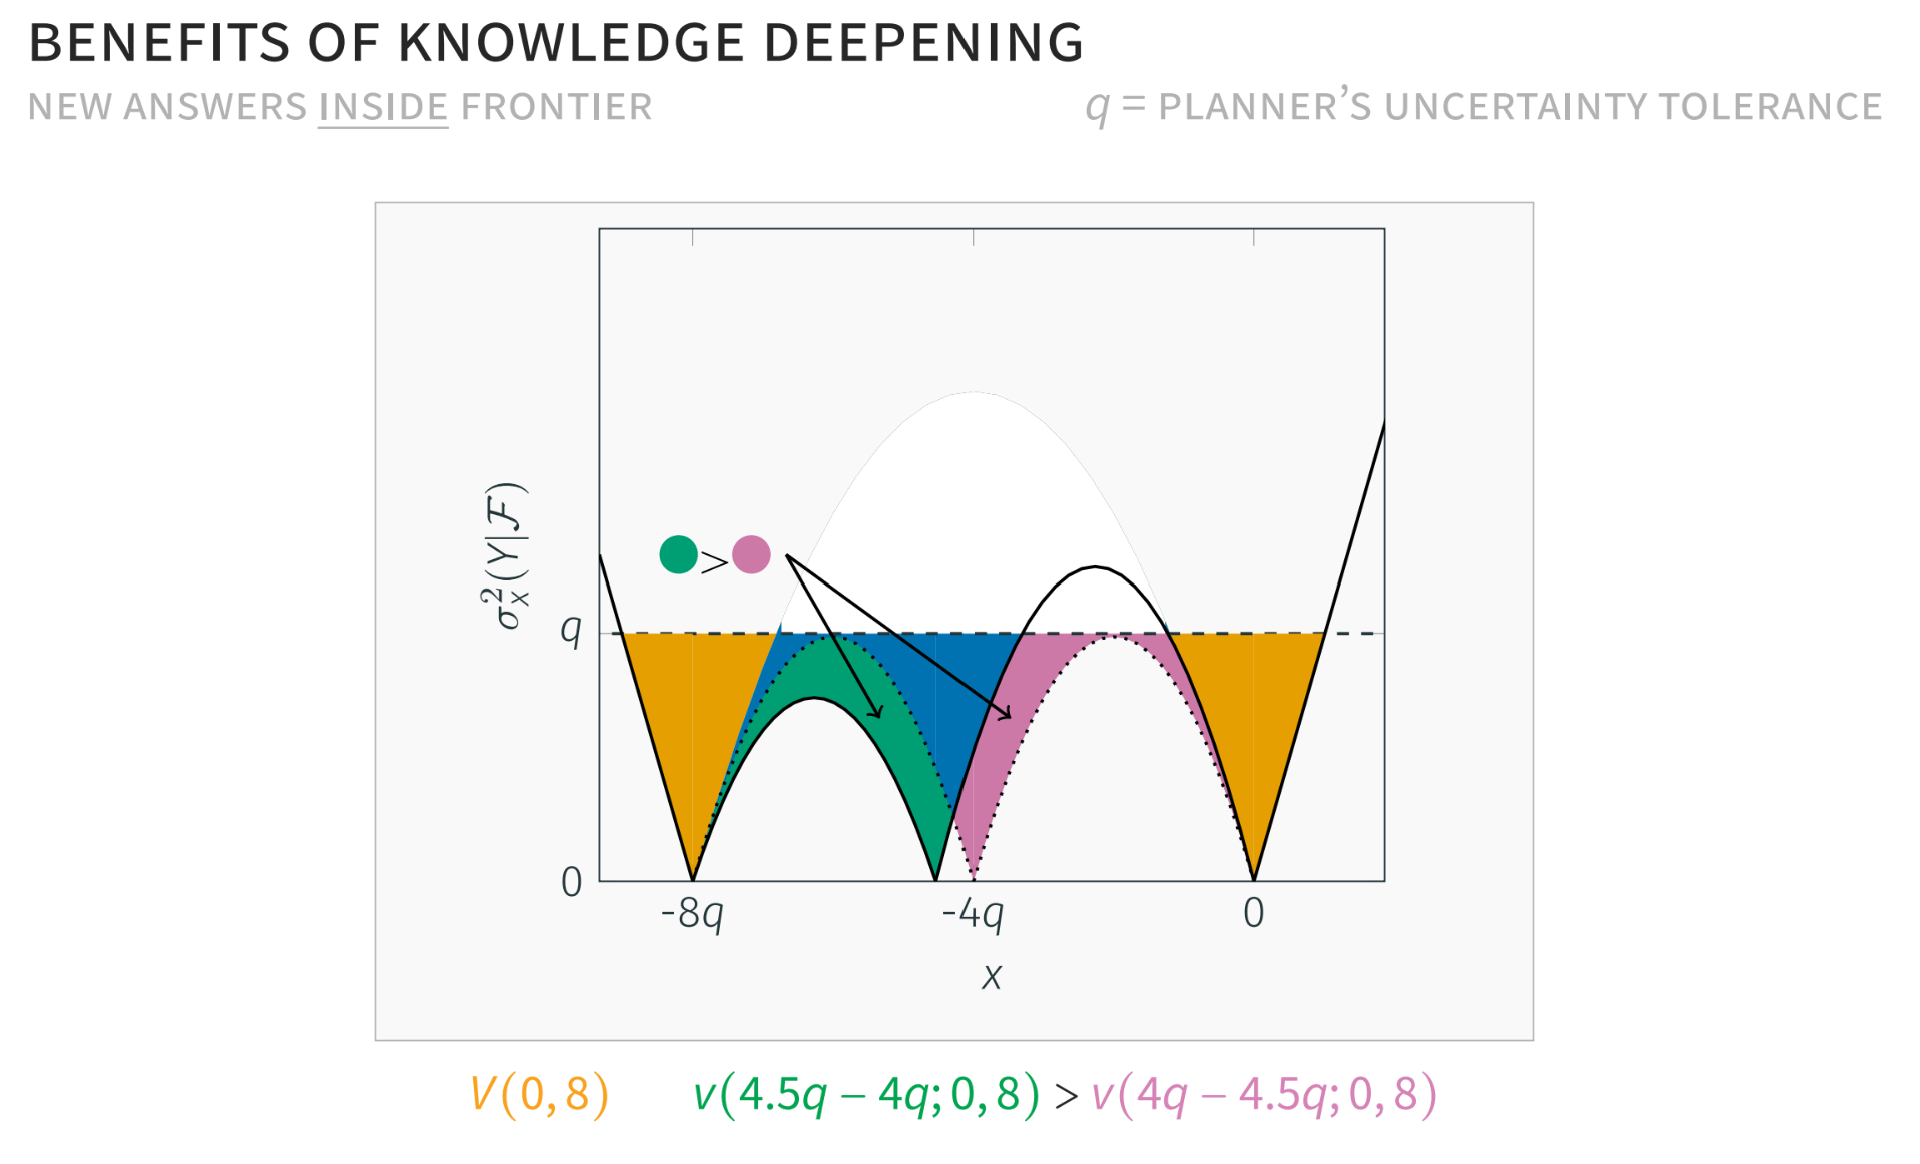
If we know 0 and we know -8, it turns out that going to -4 is actually not optimal, and stretching a bit out to like -4.5 is actually optimal. This is where math is helpful but also shows you that intuitions can go awry sometimes.
Moonshots
One thing this paper walks through is this idea of moonshots, which is a super interesting concept that’s really hard to think about formally, but this model gives you a nice way of thinking about what moonshots do.
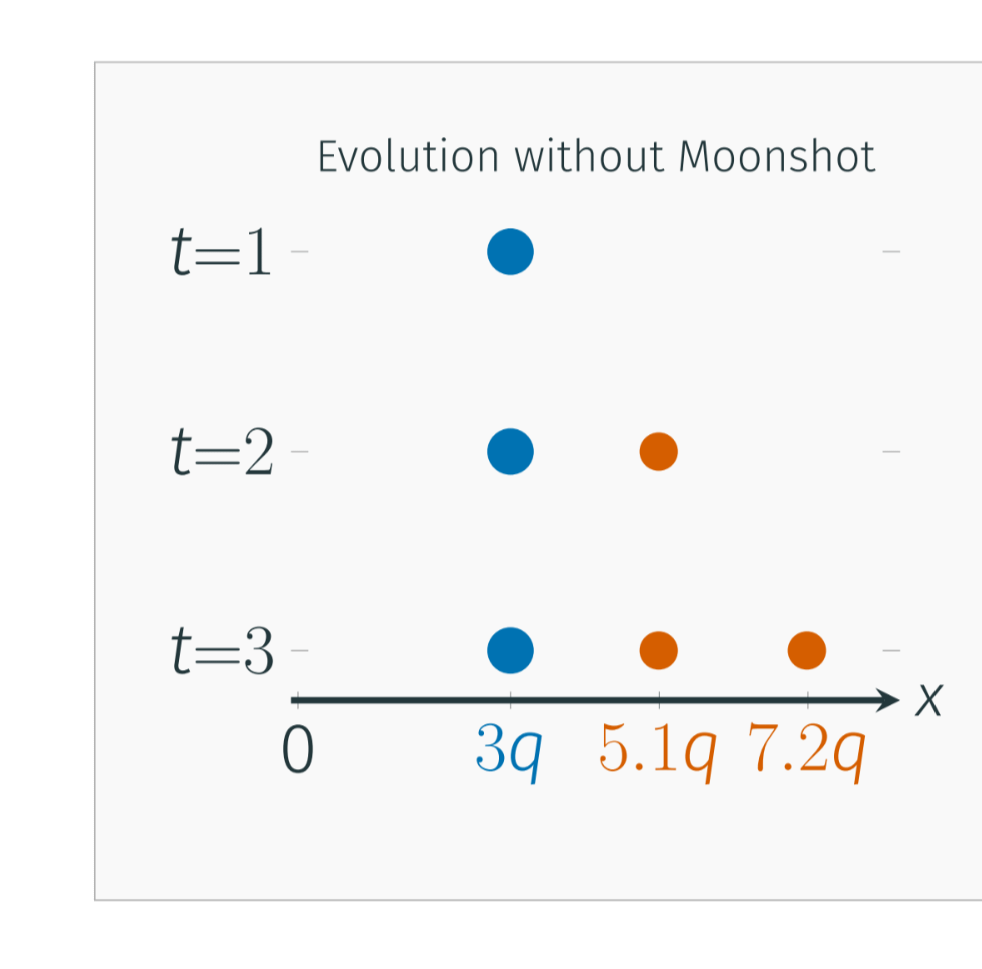
First, on the left, we’re going to walk through what happens in a world where we don’t do a moonshot. In the first period, t equals 1, let’s say we take a medium shot out to Question 3. In the second period, we let the market proceed in equilibrium. Where do people go? They say, okay, I can create the most value by going out to 5.1 in this case. The third period, where do we go? I push the frontier again and go out to 7.2.
What does a moonshot do?
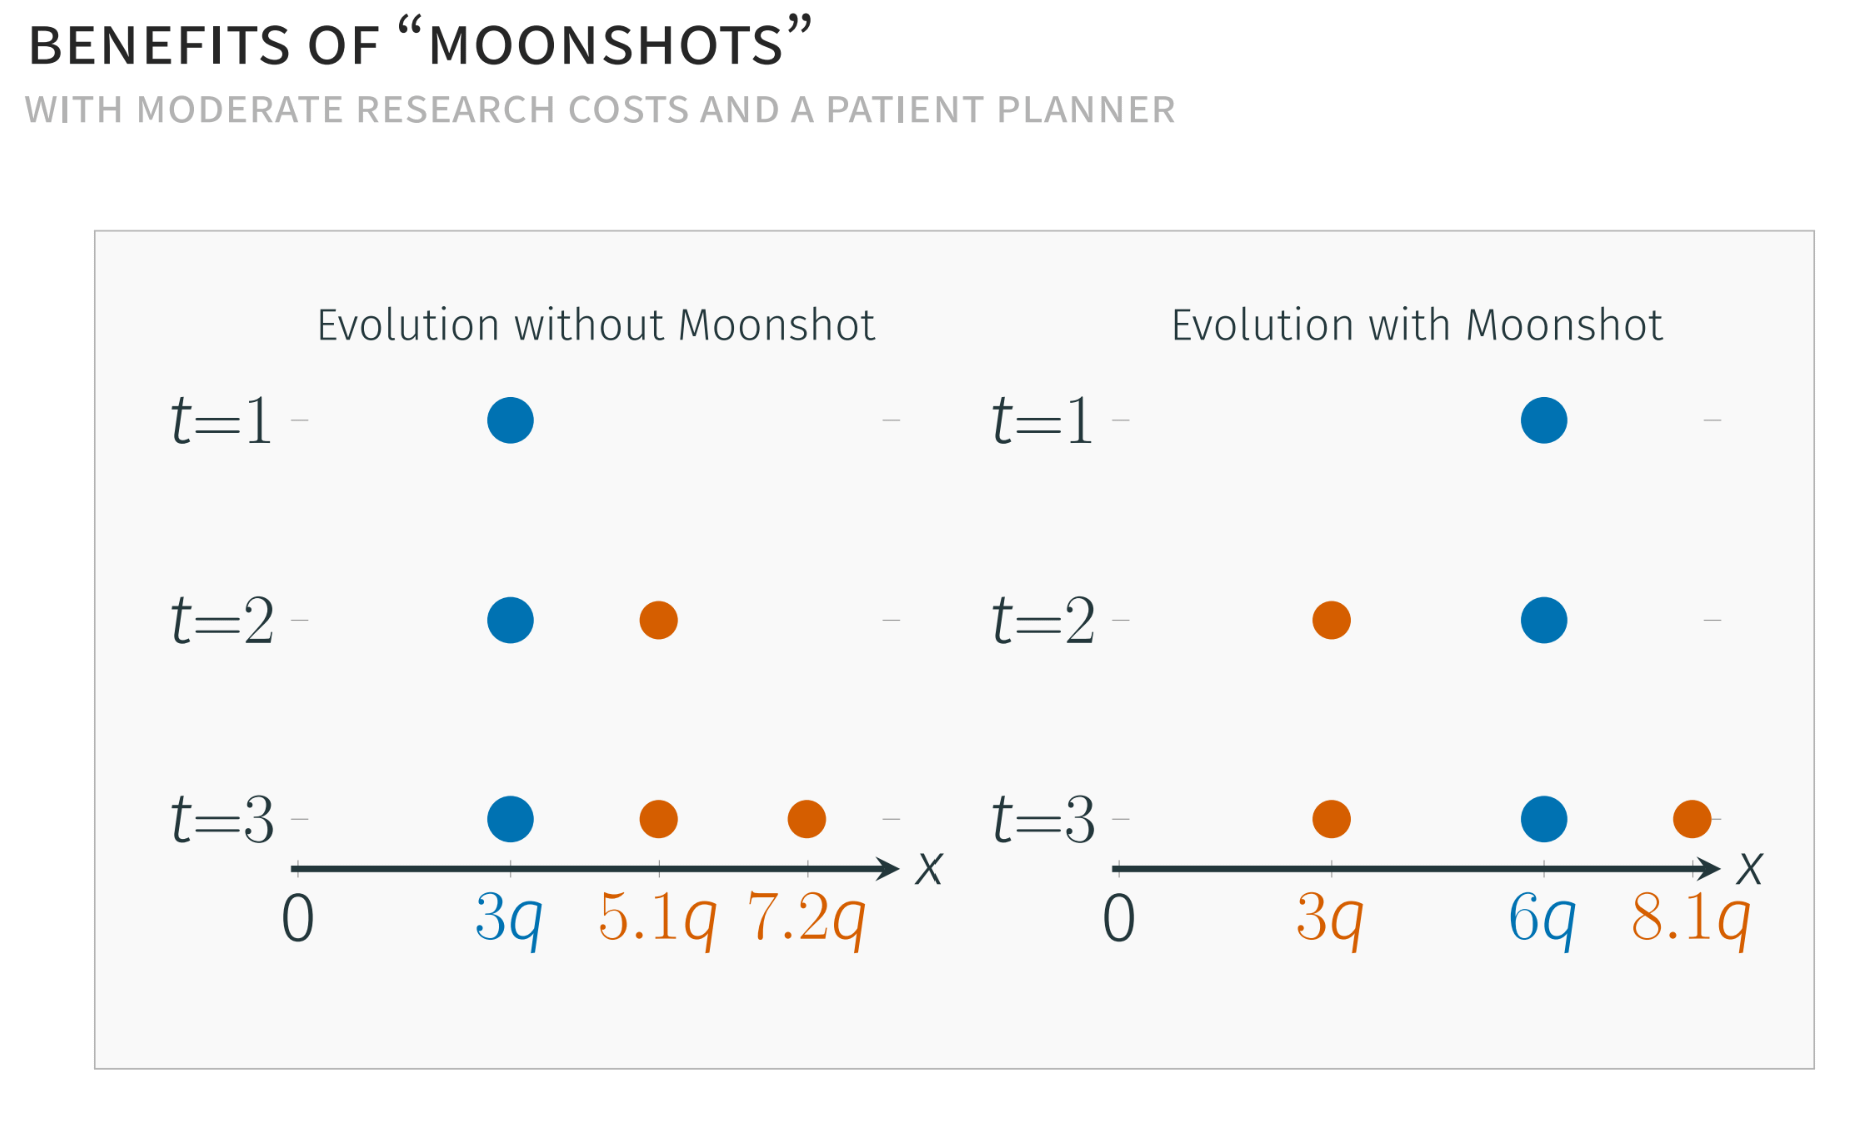
A moonshot says, in Period 1, I don’t want to just settle for 3. I want to go all the way out to 6. That, in and of itself, in that first period, is worse — less value is created. But, in a dynamic sense, under certain conditions, it can actually create more value. If you let the market move forward in equilibrium from there, it says, “We know 6 now, where do we go optimally?” It turns out optimally is to fill in and deepen back at 3, because we can create a lot of value in that middle space that just opened up. Then, in the third period, where do we go from here? If we know 3 and 6, it turns out we can get further than we would have gotten without the moonshot. We can get all the way to 8.1. These magnitudes are irrelevant and very hard to think about in practice. The logic of what a moonshot does is, it makes the value of these connecting ideas, like the three over here, valuable.
To summarize it, I’ll take a phrase of Pierre Azoulay’s: this paper very much is about trying to get you to respect the geometry of knowledge, insofar as the optimal science policy is not a time-invariant thing.
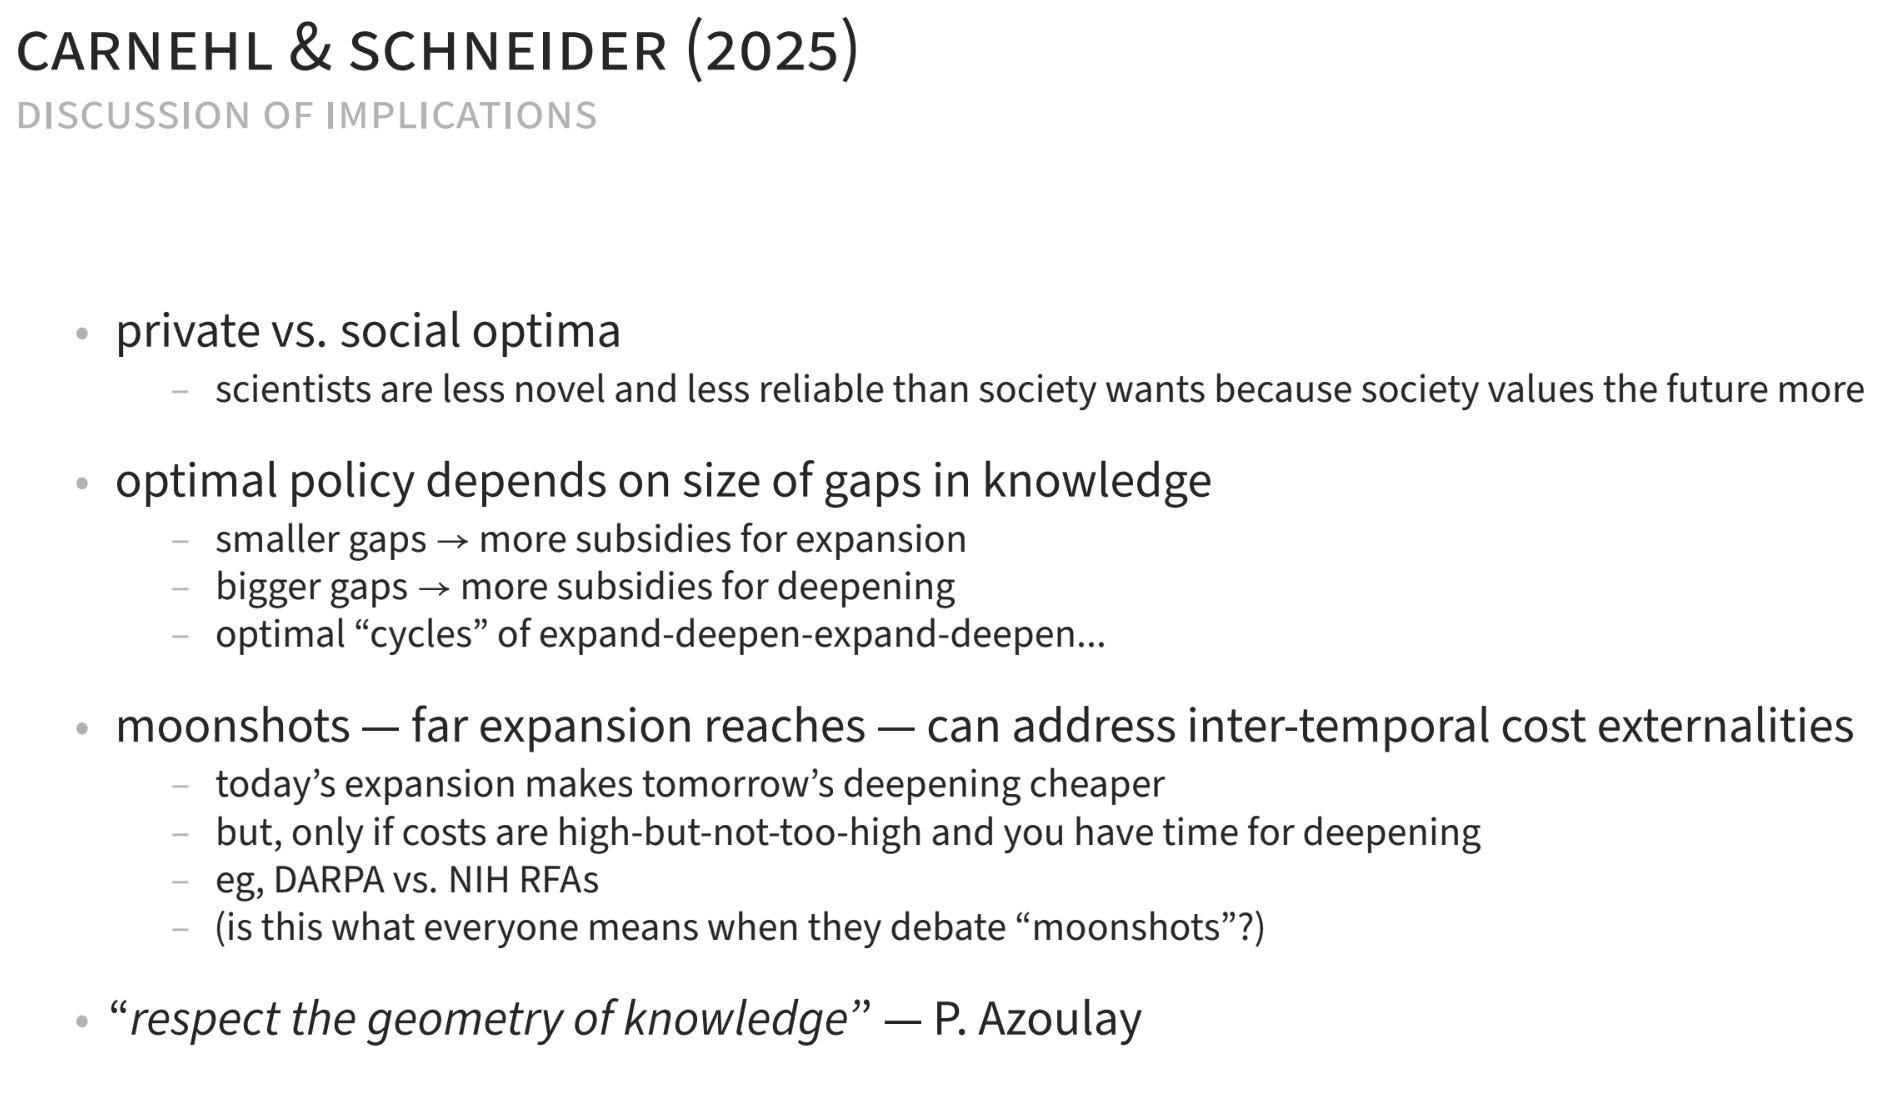
It depends on where all our current knowledge points are. Does that mean we should take some deepening steps to fill in gaps, or does that mean we should take some expansion steps? It introduces this idea of the optimal flow of science looking like a cycle of deepening and expansion, where we throw out a fishing rod very far, we catch a fish, and then now we know where the fish are in between us and that fish, and we fish in between for a while, but then eventually we fill all that out. Then we throw out further again and expand, and then we fill in. That cycle nature is a very interesting concept to engage with.
Conclusions
Moving forward, and where I think things are going in these modern times. First, I think all of these things are still very relevant.
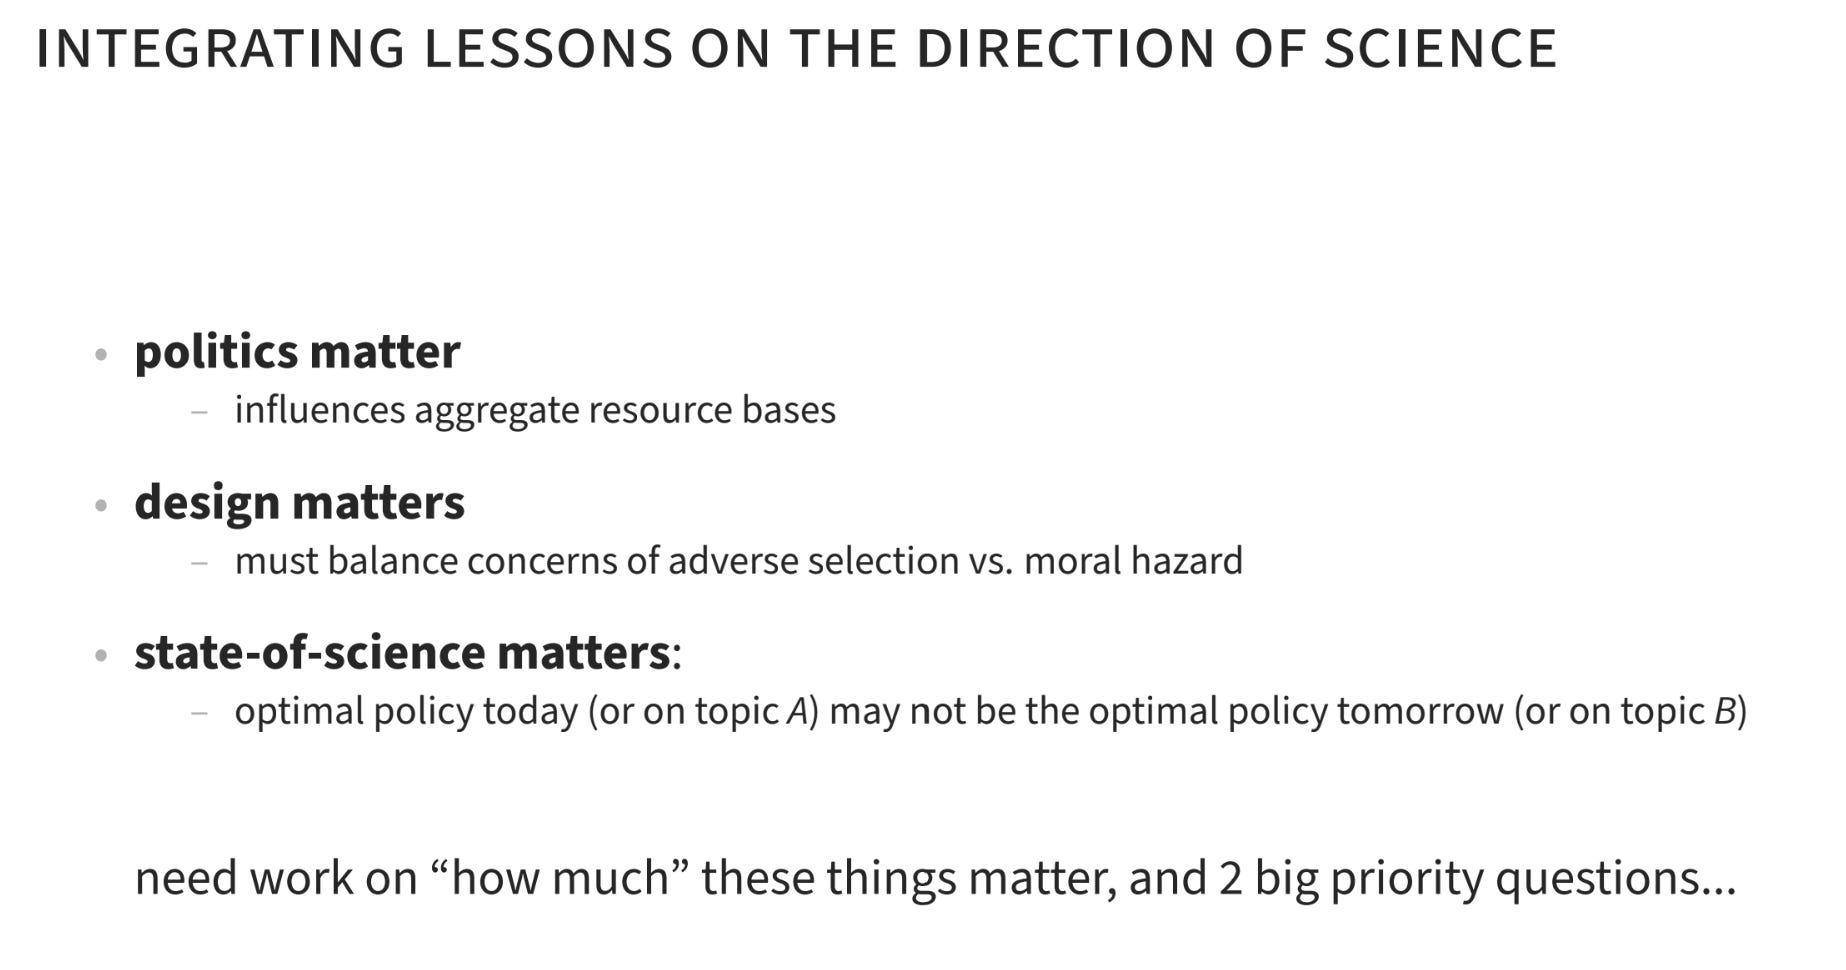
One of them that hopefully has shown through a bit in today’s discussion is that we’re getting a better sense of what matters. We can reject a lot of null hypotheses, but there’s a lot of work to be done in terms of how much a lot of these things matter. To the point earlier about framing research questions and noise, what are the important sources of noise? I don’t think we have a very good sense of those kinds of questions. Two big questions that I’m interested in right now.
“Allocative efficiency”
One is thinking more about allocative efficiency, which gets back to our graph from before.
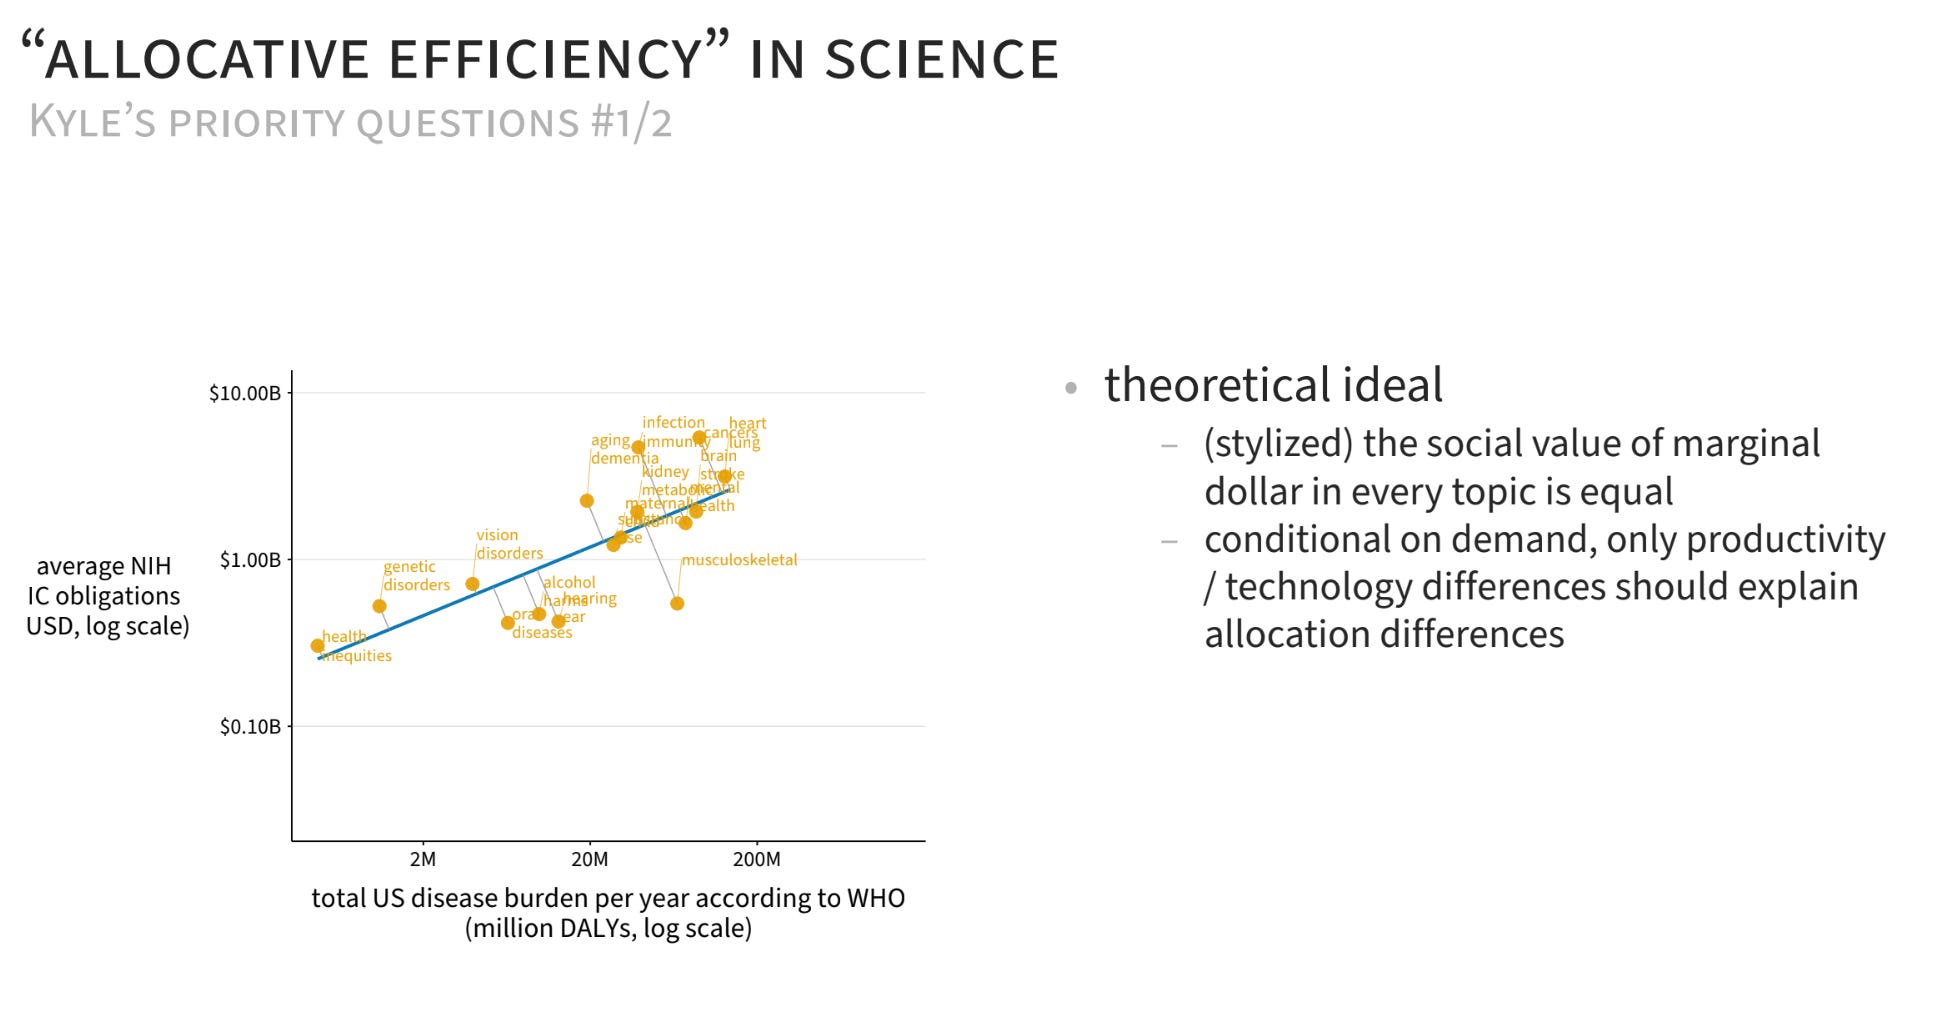
A fun thing you can do with this graph is say, “Why are there residuals?” Let’s assume even for a moment that the WHO knows how to measure these things and this is a correct measure of demand. In the theoretical ideal, the only reason there would be residuals conditional on demand would be that productivity is different across these places. We don’t invest as much in musculoskeletal because it’s a really hard thing to study. Even though the demand is the same, the supply curve is just flatter, so we’re going to invest less, and that would be economically rational from a very classic utilitarian objective.
Just to give you a sense of how big these gaps are as something to investigate: I’m plotting here those residuals in percentage and dollar amounts, so you can see the scale of these residuals.
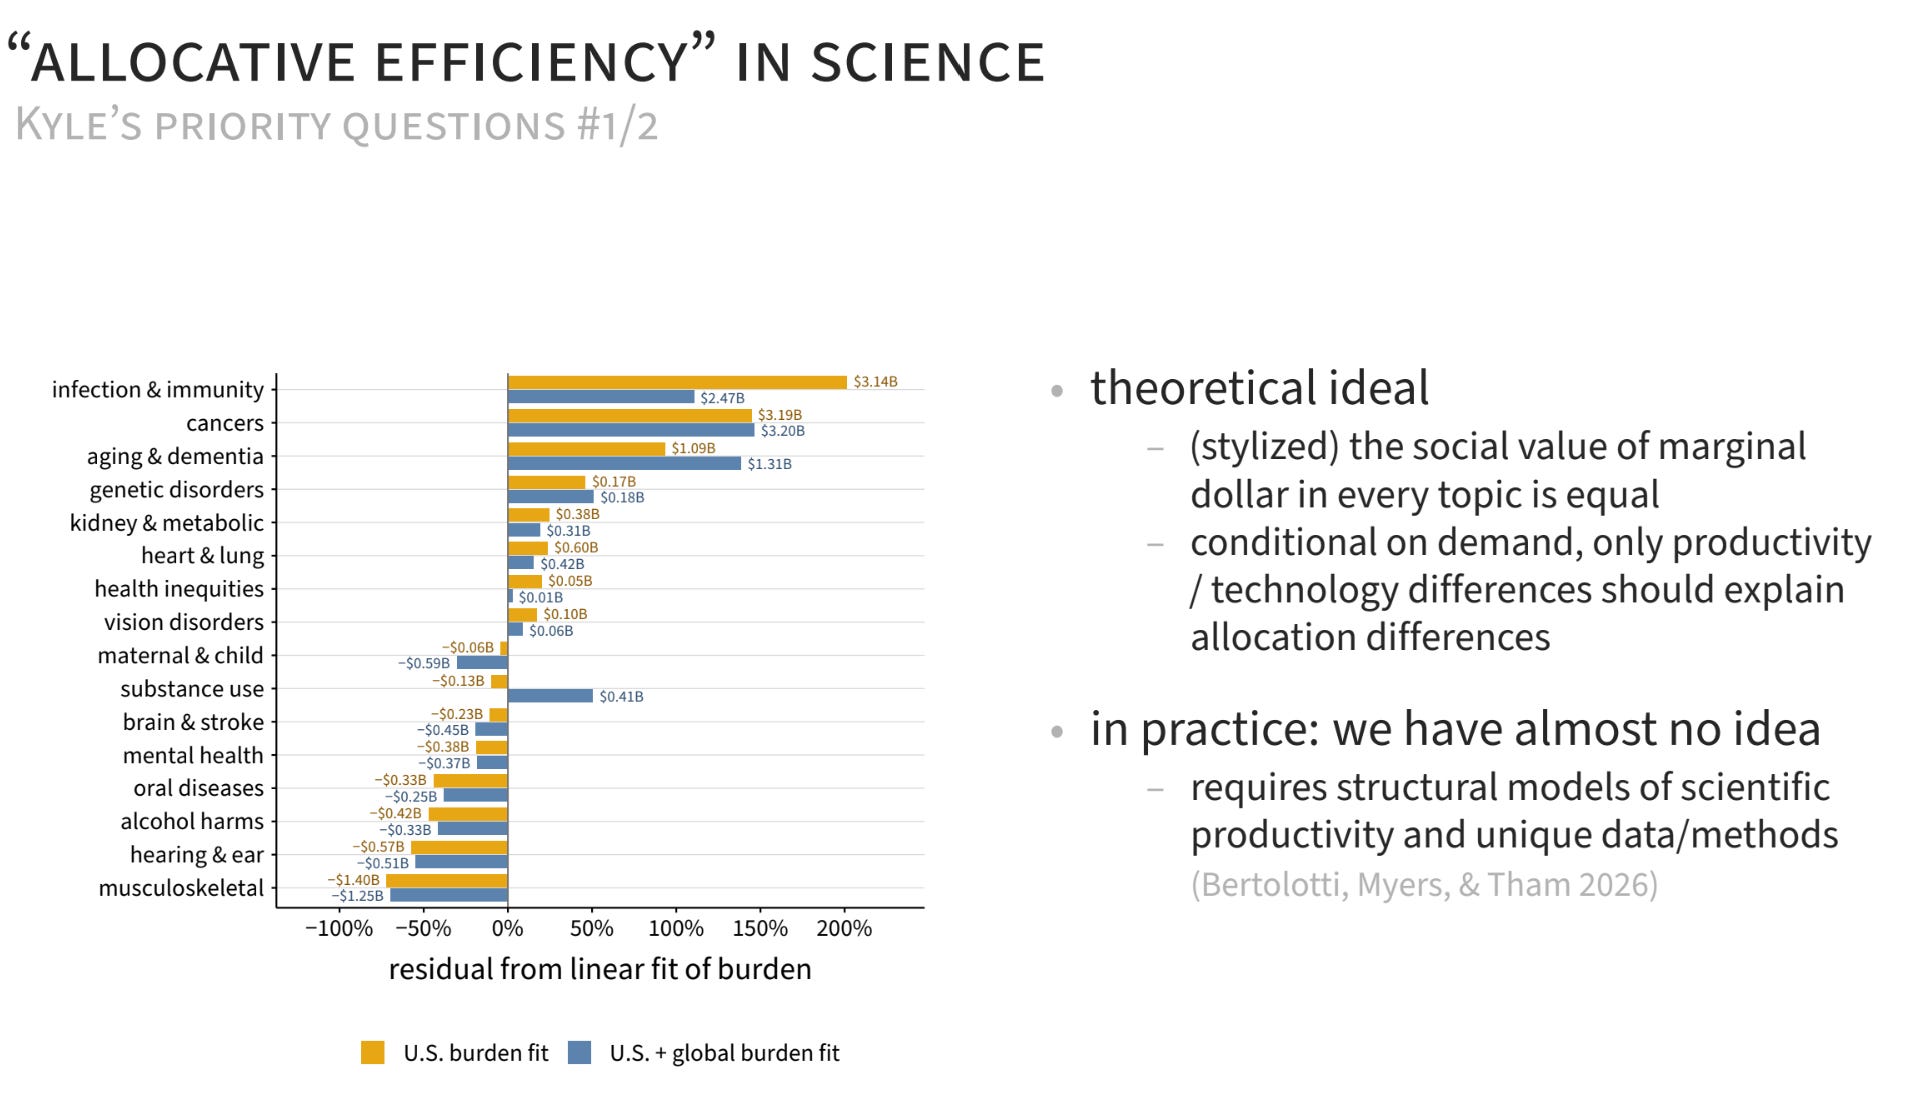
The yellow lines are just based on regressing the NIH budget on the US burden. The blue lines add in the global burden, which is important. You can see, for example, in the infection immunity one at the top, just looking at the US it looks like we invest a lot relative to demand, which could mean that infectious disease research is very productive. Or it could mean that we put a weight on infectious diseases that affect not the United States. In fact, that’s exactly what you see: once you include the global burden for infectious diseases, that residual cuts in half. So a lot of what might look like investment not due to demand in the US is actually investment because the US, by revealed preference, cares about the rest of the world. To the right extent is a very interesting question, but you can see that happening in that portion of the data.
In practice, we have no idea. There is so little research that uses the tools of what you would call modern industrial organization and productivity analysis of standard firm-based markets. We don’t have a very good sense of what this allocative efficiency looks like in science. I have a paper with my good friends Fabio and Wei Yang, Productivity Beliefs and Efficiency in Science, where we’ve done our best to take a stab in that direction, but I think that’s a very interesting place to pursue. It’s very hard, because a lot of the things you need to do these kinds of studies are not traditionally recorded, but I think it’s very important.
AI and scientific infrastructure
Last, I can’t not talk about AI, even though I don’t want to talk about AI. Something interesting with respect to the direction of science and AI is not who’s going to come up with the tool that makes science go super fast because it can discover drugs — that is a very important question. I, as an economist interested in social welfare, am interested in the question of how AI will change scientific infrastructure, in terms of how we allocate credit, resources, and the structure of science.
There are fun history examples of even seemingly small things.
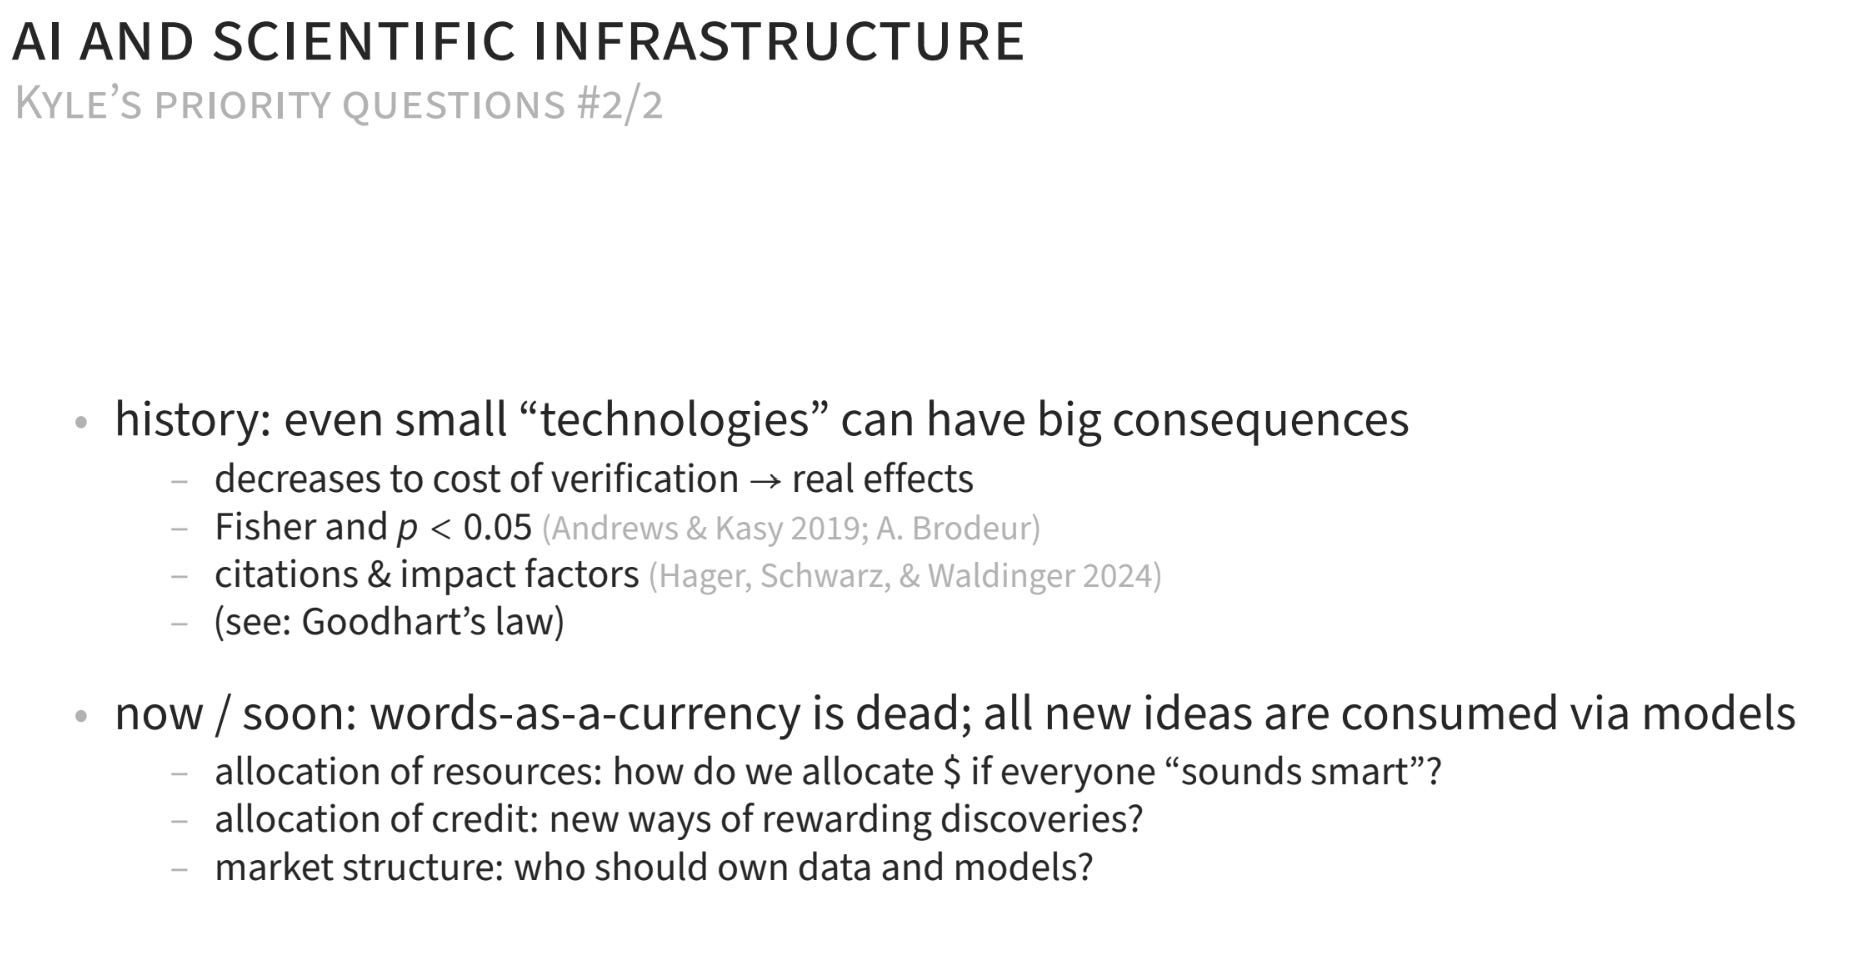
AI is clearly a big technology, and if you look back at the world, it took one famous statistician saying, “I think 0.05 is a decent rule of thumb,” to create a tremendous amount of distortion in the publication market. There are lots of very interesting papers going out. P-hacking all traces back to Fisher and a sort of off-handed comment. Another one is citations. Citations initially were just meant to be bibliographic management and acknowledgements to people reading articles. Now they are at the core of many promotion decisions and all sorts of resource-allocation decisions and have real impact. This Hager, Schwarz, and Waldinger paper is a really good paper showing how that played out in practice in the early days of impact factors and citations. The reference to Goodhart’s law is: “Once a metric becomes gameable, it ceases to be a metric.” Once an input becomes an output of measure, you’ve lost the game, because people will just go after that thing and not the ultimate goal that you actually had in mind.
Within the context of AI, the way I’m currently thinking about it, in terms of where we’re allocating resources in the direction of science, is that a lot of how this used to play out worked via a currency called words. The cancer researcher would use big fancy words that convinced other researchers that they deserved money to pursue cancer research and not another infectious disease project. In a world where currency holds value, through the lens of traditional price theory, that can be an effective way of allocating resources, because the cancer researcher had a better idea, so it was easier for them to use words to get resources for their idea. Now, if Zachary truly has a better idea than me, but I can put my crappy idea into Claude and polish it up so that it sounds equally good, that starts to present some problems for how we allocate resources. This is not unique to science per se. People are already looking at this in labor markets — in recruiting, this is a very common problem, anywhere that words were a currency. I think clearly words were a currency in science, and so we’re going to have to think about how things are going to change in this new era, which is very exciting.
I think it’s a tremendous opportunity — if all new ideas are consumed via models. One challenge with all of the research on the direction of science historically has been that we couldn’t observe an idea, or define it, or see how my idea made its way to William’s work. But in a world where my idea is actually digitizable and goes through a model where we can measure its Shapley value, and William has a willingness to pay for OpenAI, who know the Shapley value, who can pay me, and I have data — I think really interesting technological advances might facilitate a more efficient market. That gives me hope amidst the wave of AI slop that appears to be oncoming.
I know Chad makes a very convincing argument that in the long run population is what matters, and when you’re thinking about growth rates. Ideas getting harder to find is a tremendously important idea.
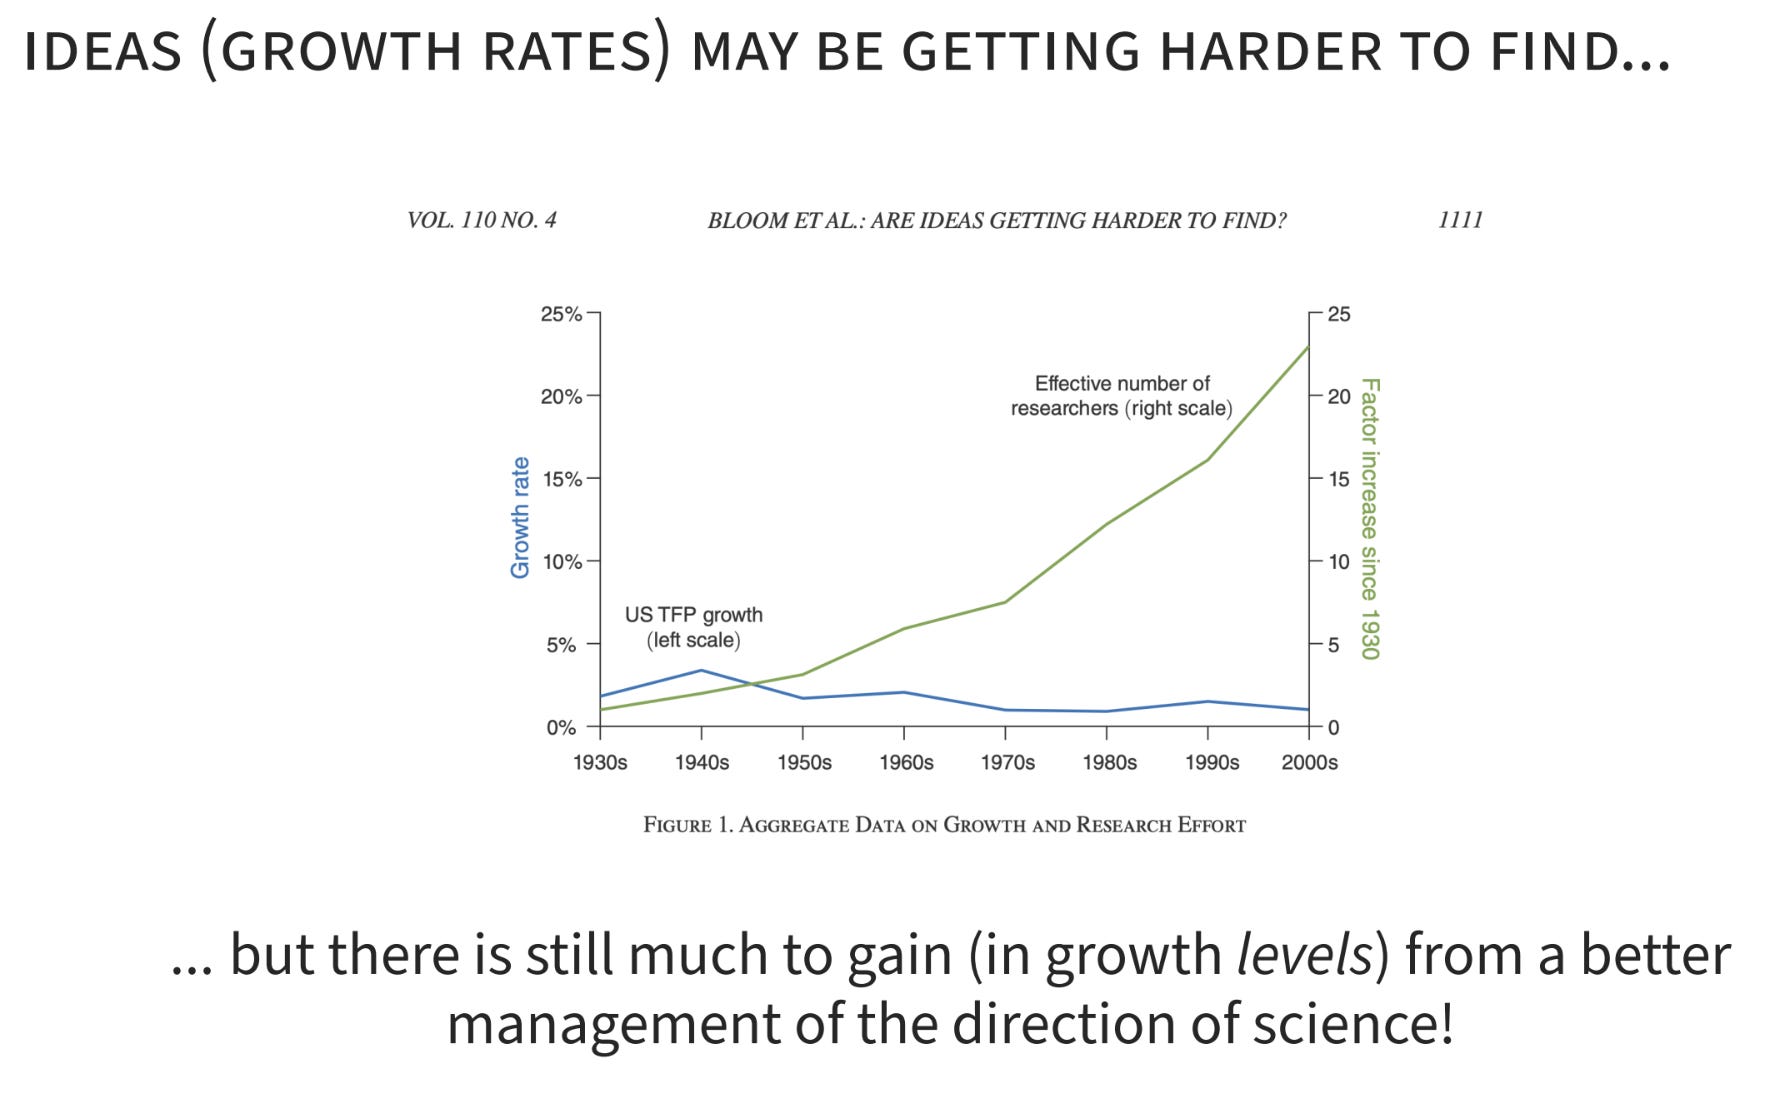
But as a pragmatist who cares about growth levels and has a non-zero discount rate, I think there’s a lot of work to be done to increase productivity, even if it’s just a level effect. I think a lot of value can be created by taking grant design more seriously and taking AI more seriously as a part of the resource allocation.
A companion National Bureau of Economic Research (NBER) paper Selecting Innovation Funding Mechanisms: A Framework for Policymakers also came out in July. Authors include IFP metascience fellow Matthew Esche and co-founder Caleb Watney, along with Matt Clancy, Siddhartha Haria, Claire McMahon, and Christopher M. Snyder.
Wow - very nice! Appreciate the Atlas of Innovation, will include that in our Futures Center resources!