


This lecture features the second of two famous economics Joneses. Last time we gave you Ben Jones; this week it’s Chad Jones.
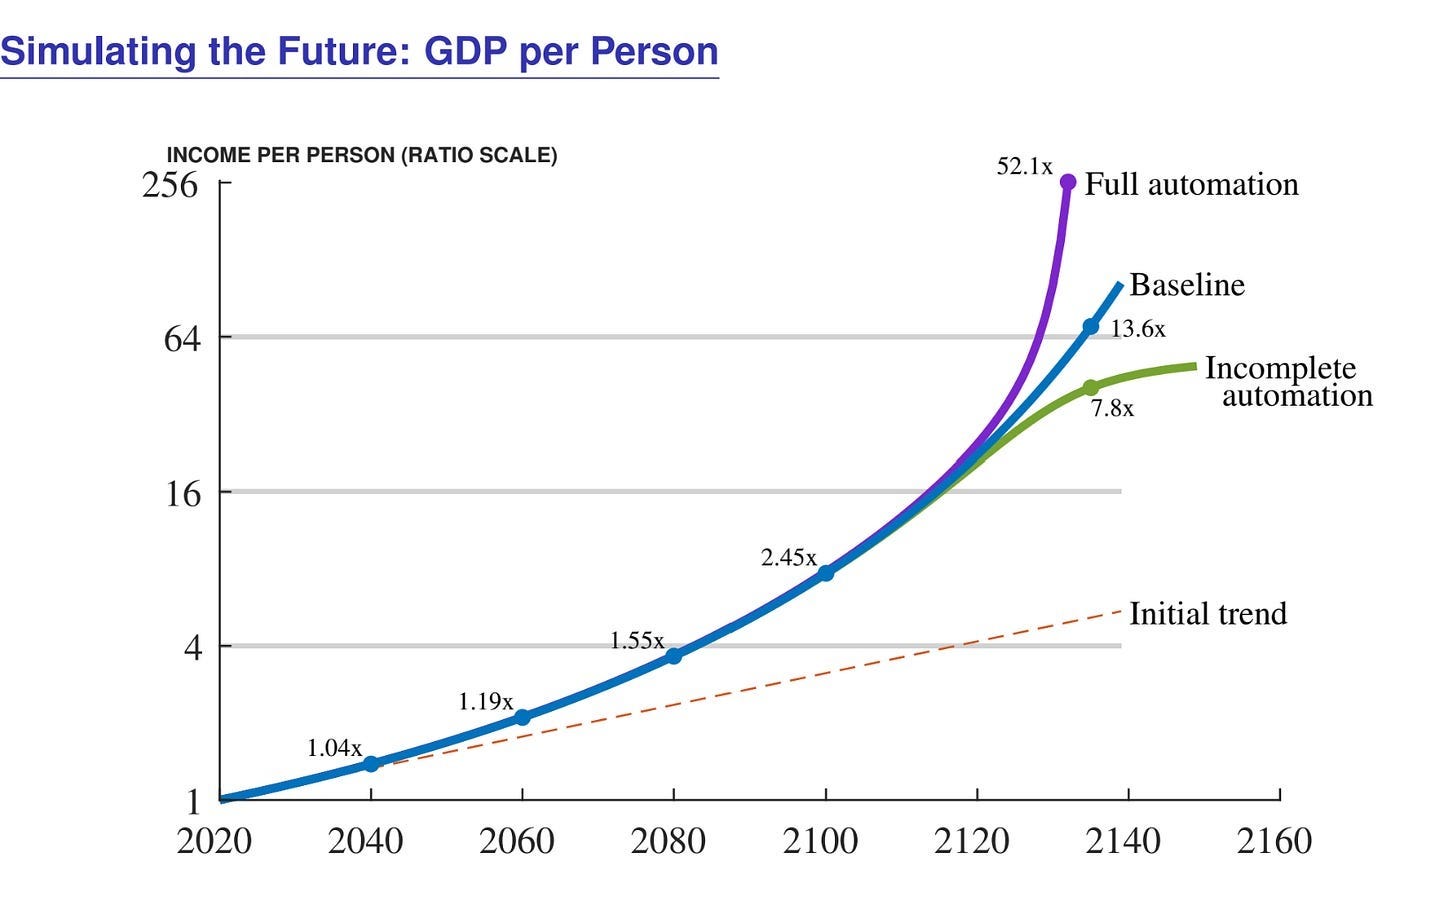
In this lecture, Chad discusses how innovation and technology has shaped economic growth in the past, and how technology — in particular artificial intelligence — may influence growth in the future. I found the section toward the end of the lecture on the potential growth effects of AI and automation fascinating; one of the big insights from Chad’s modeling efforts is that the growth effects may lag considerably. So you might get profound abundance, but not until 50-100 years in the future. See below for a hint of what you’ll get in the lecture.
Chad will have a chance to dig deeper into the economics of AI while influencing the technology’s future. In June, he announced that he was taking a leave of absence from Stanford University to conduct research on the economics of AI at Anthropic.
Here are the readings that go with this lecture:
Bloom, Nicholas, Charles I Jones, John Van Reenen, and Michael Webb. “Are Ideas Getting Harder to Find?” American Economic Review 110, no. 4 (2020): 1104-1144.
Jones, Charles I. “Growth and Ideas.” Handbook of Economic Growth 1B (2005): 1063-1111.
Jones, Charles I. and Christopher Tonetti. “Past Automation and Future A.I.: How Weak Links Tame the Growth Explosion.” Stanford unpublished manuscript (2025).
Jones, Charles I. “The Past and Future of Economic Growth: A Semi-Endogenous Perspective.” Annual Review of Economics 14, (2022): 125-152.
Romer, Paul M. “Endogenous Technological Change.” Journal of Political Economy 98, no. 5 (1990): S71-S102.
Thanks to William Higbie and Harry Fletcher-Wood for their support in producing this video and the transcript.
Lecture Transcript:
The Past and Future of Economic Growth: A Semi-Endogenous Perspective
I’m going to present two sets of slides. First, an overview of how I see economic growth with some applications. Second, on AI and our economic future — a review of the recent work I’ve been doing.
The first thing I want to do is give you my view of how the economic growth process works. Here’s my favorite graph in economics.
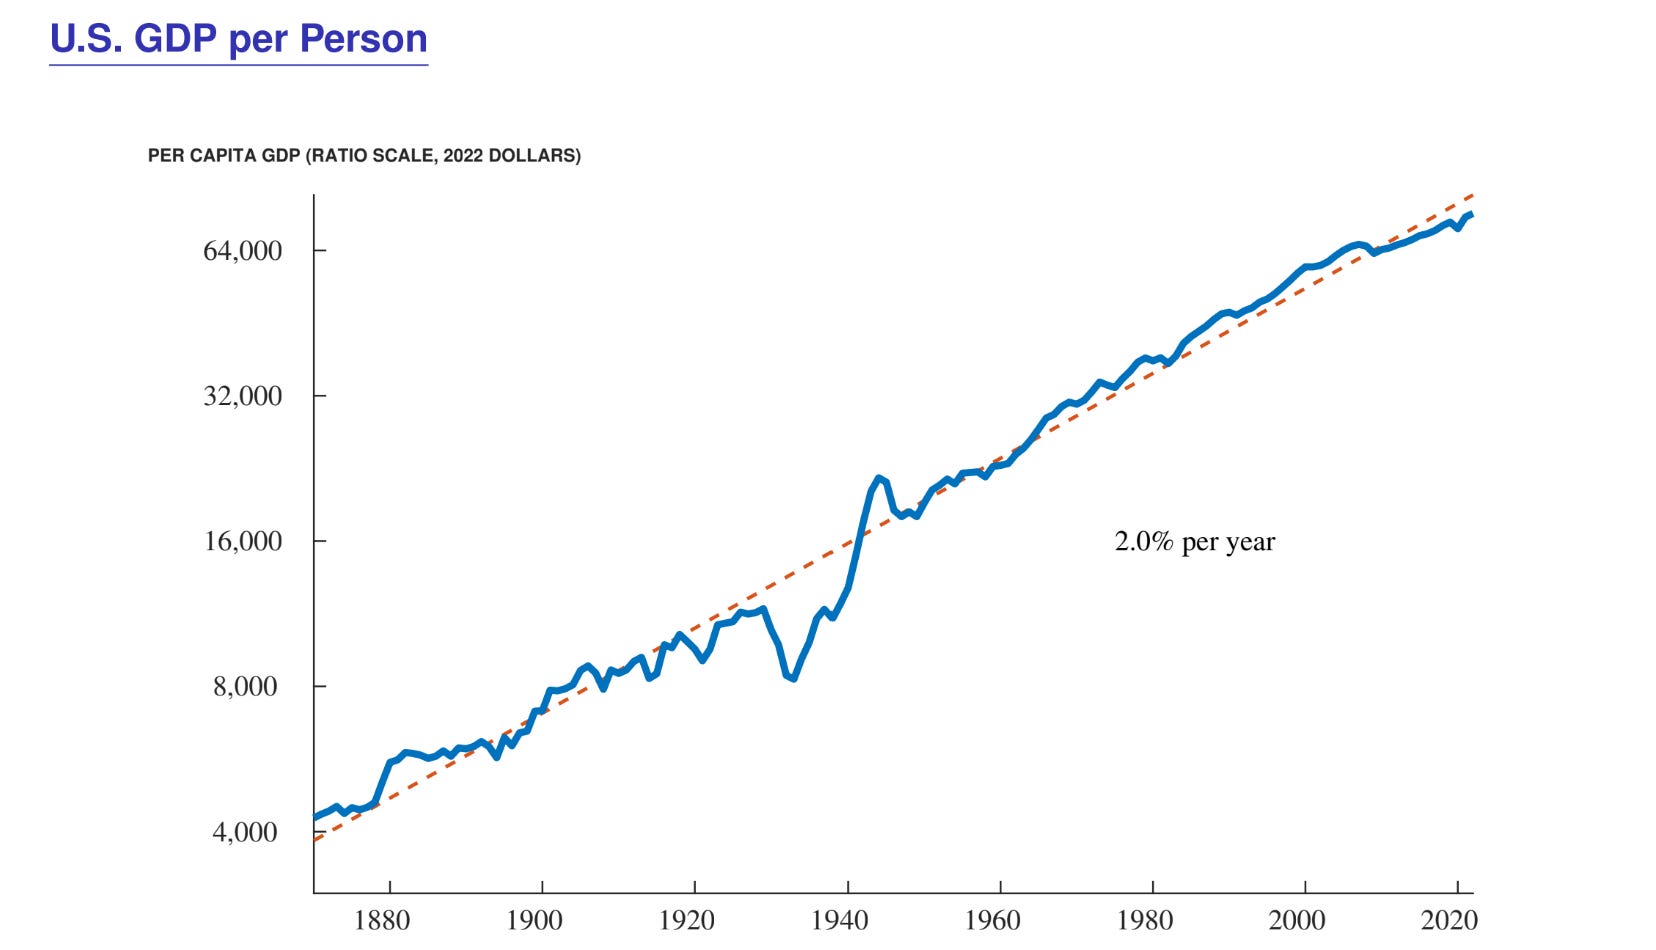
This is a chart of GDP per person — average living standards in the US for the last 150 years. Once you plot it on a log scale, it’s a straight line with a slope of 2% per year. One of the big questions of the economic growth literature is, “How is sustained exponential growth at a stable rate for 150 years possible?” There are a bunch of growth models — a bunch of answers. But I want to give you my preferred answer.
I love simple models. Once you claim you understand something, it ought to be possible to strip out a bunch of ingredients that are unnecessary to show the core insight as simply as possible. You definitely don’t start there, there’s an arc — but it’s great to end up there.
I want to do that.
I want to talk about some growth accounting with this model.
Then, I might skip through the future of growth: why it might speed up or slow down.
That will take us naturally into the artificial intelligence material.
What’s the simplest possible model you can write down that gets at the core insight of why sustained exponential growth is possible? The key insight here is Paul Romer’s Nobel Prize for what I like to call “the infinite usability” of ideas. Romer pointed out that ideas are different from almost every other good in the economy. Most goods are objects. iPhones, airplane seats, surgeons, me, you, my computer, my office. Objects are rival. If I’m using it, you can’t use it at the same time. That rivalry is what gives rise to the fundamental scarcity at the heart of economics — economics is the study of how we allocate scarce resources.
Ideas are different. They are nonrival. I don’t like defining it as the negative of something else, so I prefer “infinitely usable.” Once you invent an idea, it’s technologically possible for it to be used by any number of people simultaneously without any depletion. You don’t run out of a given idea. Think about calculus, or HTML — the code that underlies web pages — or the chemical formula for a new drug. We invent the COVID vaccine and eight billion people can benefit simultaneously without any depletion. Contrast that with a barrel of oil or an apple: you or I can eat it. But we can all use calculus, computer code, or the latest ChatGPT. The code is nonrival.
The essence of Romer’s insight was, when you write down the production function — suppose A is the stock of ideas: the total number of ideas ever discovered. If we think of ideas as recipes in a cookbook, A is the number of recipes. Why, when you include ideas in a model, do you want the A outside the constant returns rather than inside?
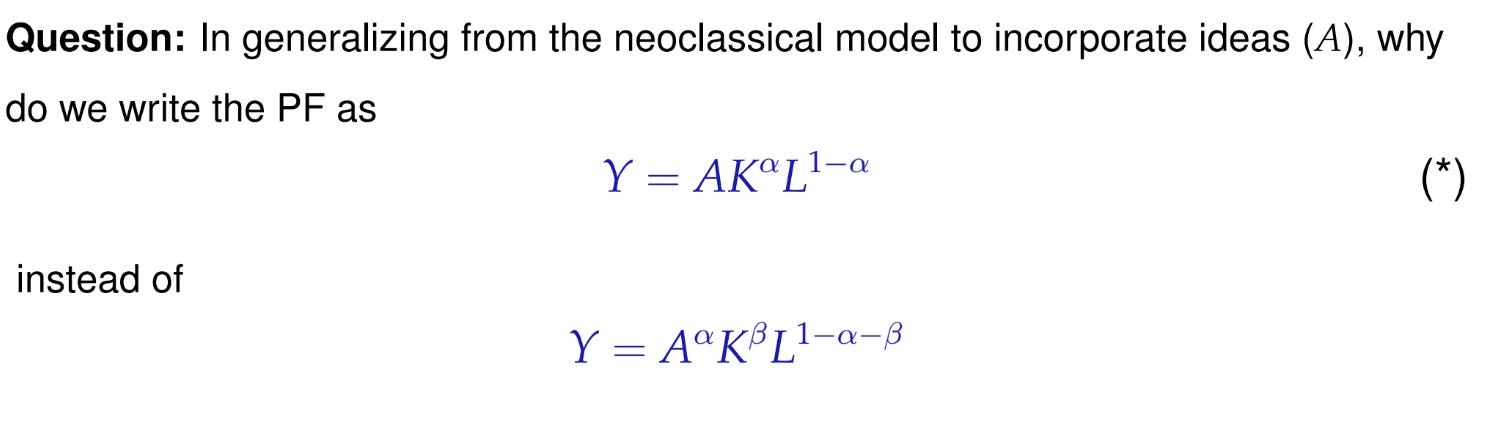
This is a profound question. Your bias should be that everything goes inside the constant returns to scale. If we’re adding land, or splitting labor into skilled and unskilled, or splitting capital into equipment and structures, all that goes into the constant returns to scale. The default is that ideas should go in the constant returns to scale just like everything else, and you have to have a good reason for it not to. Griliches, when he was putting ideas in a model, put knowledge capital inside the constant returns to scale, exactly as he should have done if he didn’t have a good reason not to. Romer taught us the good reason not to, and why you want to pull the ideas outside the constant returns.
Let me talk about the constant returns to scale. Suppose we’re looking at Steve Jobs and Steve Wozniak in the garage in the ‘70s making the first personal computer. It’s the two of them, some screwdrivers, computer chips, and a keyboard. The reason you want to write constant returns to scale is because of the replication argument. If Jobs and Wozniak can make seven computers a week in their garage, one way to double production is to replicate it: create an identical garage, get two people identical to Jobs and Wozniak, and get the same computer parts. If we’ve replicated everything, we should produce the same amount. We’ve doubled our inputs and therefore doubled our output. That’s constant returns to scale. The replication argument is why I say the presumption should be constant returns to scale.
Yet once you think about ideas, that breaks. Why? Back to the Jobs and Wozniak example: there’s constant returns to scale after they’ve discovered the idea. The blueprints for building a computer are written down on a sheet of paper. The piece of paper is an object that needs to be replicated, but you don’t have to reinvent the design. You photocopy the design — you double the number of pieces of paper. But you don’t have to pay the years of work that went into getting the blueprint for the first computer. You have constant returns to scale to objects — that’s the replication argument — and therefore increasing returns to objects and ideas.
If you read the Romer 1990 paper, this core insight is in the first five pages, and he expresses it in some math just like this.
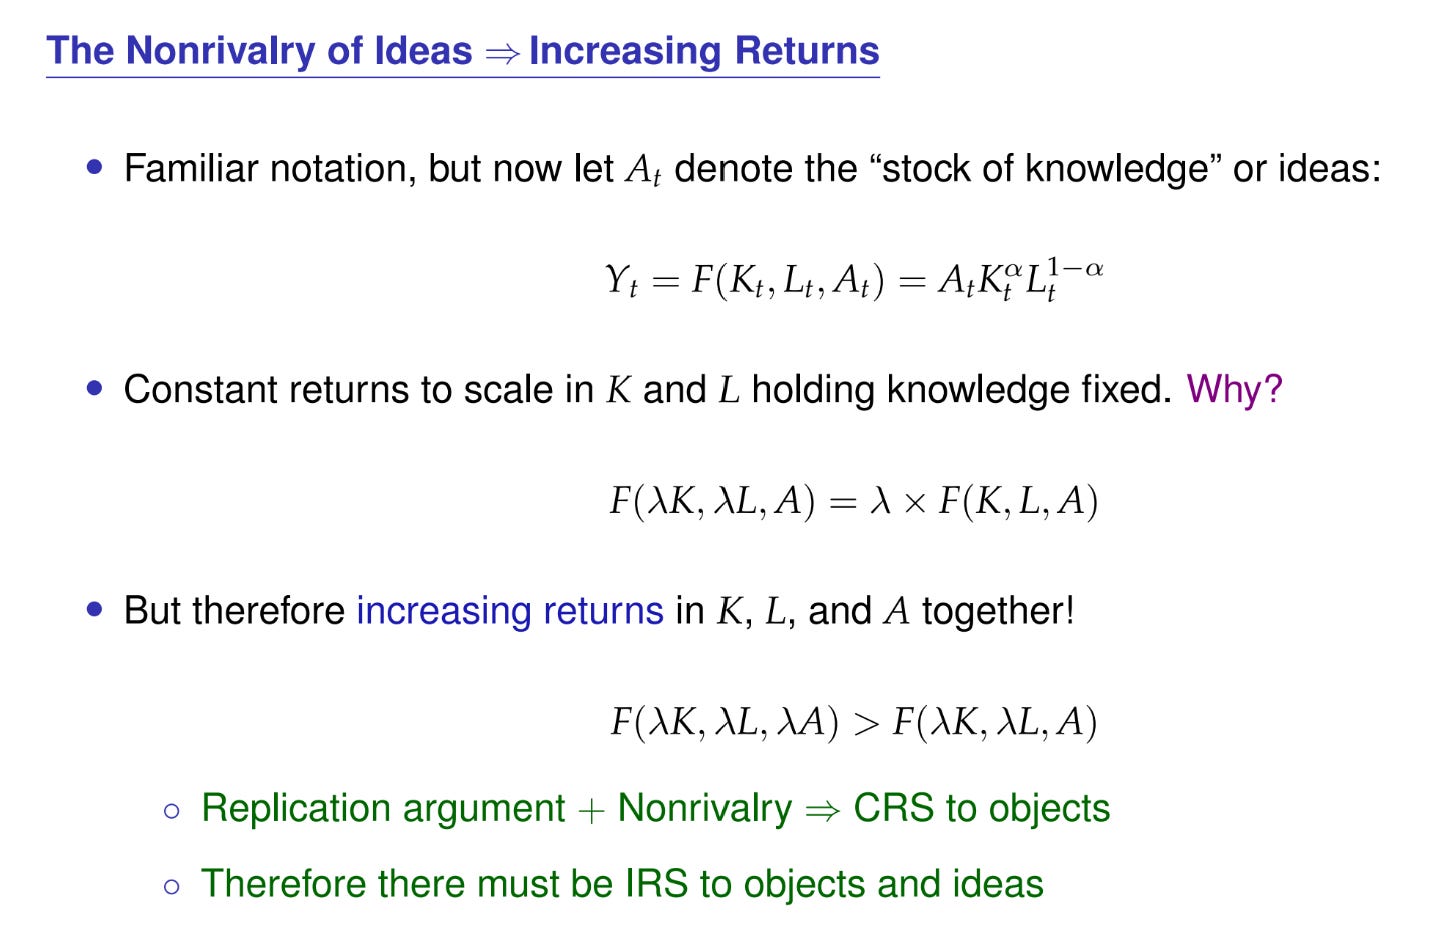
If A is the stock of ideas, you’ve got constant returns to K and L — they’re objects. Therefore, if the marginal product of knowledge is positive — if adding a new idea increases output — then there must be increasing returns to objects and ideas together. It is that simple. The replication argument and nonrivalry, the infinite usability of ideas, gives you constant returns to scale to objects and therefore increasing returns to objects and ideas. That’s the Nobel Prize. Everything else after that is dotting the i’s and crossing the t’s. That’s the essential insight in the way I view growth.
Now I want to write down a simple model to illustrate this core insight and how it delivers a theory of growth.
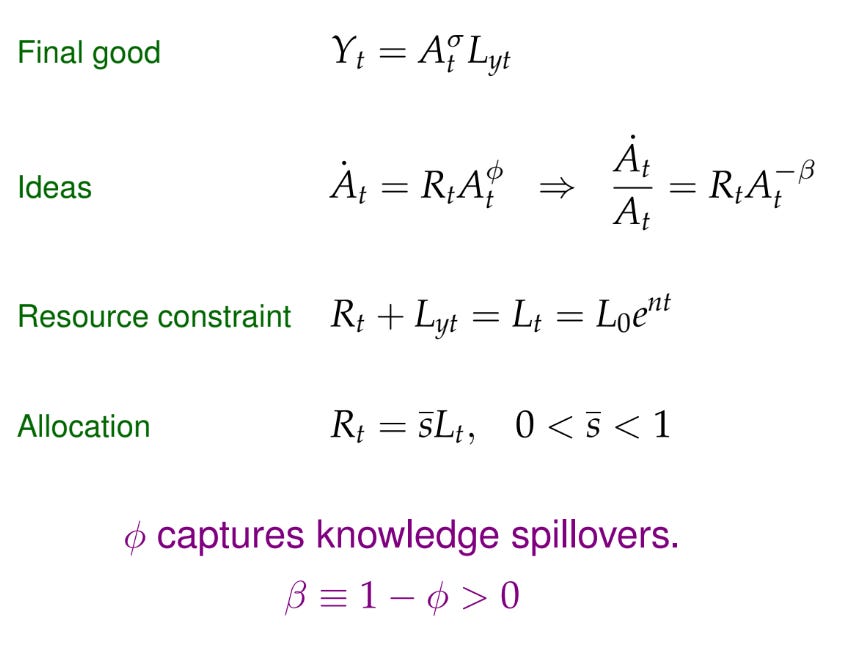
Notice I’ve dropped capital. Why? Solow taught us that capital is a bit of a sideshow — you don’t need it — so I’m going to take it out. In the first equation, there’s constant returns to labor — the only object — and A is the stock of ideas. With σ, there’s increasing returns to labor and ideas. The parameter σ measures the degree of increasing returns in the production of goods.
Then we also need a production function for ideas. Where does knowledge come from? This black box of where ideas come from is a big mystery. It turns out from the growth perspective you don’t have to solve that mystery. You can write down a standard production function for ideas and that works fine. There’s a fair amount of flexibility for how you write it down.
In the second equation, the number of new ideas — Ȧ, the flow of new ideas — depends on the number of people searching for ideas, R, and potentially on the stock of previous knowledge that’s been discovered, A.
Now I’ve got this φ exponent. What we’re saying is past knowledge could help or hurt you in producing ideas. There’s some flexibility there.
φ = 0 is the simplest possible model: one researcher discovers one new idea, and the model works great.
φ > 0 is standing on the shoulders of giants: past discoveries like calculus and information technology make me more productive at producing ideas.
But all graduate students are convinced that φ is negative. Why? φ < 0 is, “All the low-hanging fruit has been picked.” It says the more discoveries in the past, the harder it is to find new ideas today. It would be great to be an economist in the ‘50s — Solow, Samuelson, and Arrow had it easy. There was all this low-hanging fruit. Nobel prizes were hanging there. You just had to pick the apple. Graduate students today are climbing up the tree looking for the last remaining fruit, out on the branch precariously balanced, just to get the smallest of apples. It feels like ideas are getting harder to find in a strong way and that φ is negative.
It turns out the model works fine whether φ is positive, 0, or negative, which is a nice feature.
In recent work I found it helpful to rewrite this equation in terms of the growth rate of knowledge and define β to be 1 − φ. β captures the rate at which ideas are getting harder to find. Sometimes I like all my parameters to be positive. Both ways — the φ way and the β way — have lots of merits, but I go back and forth.
The next equation is the resource constraint. We’ve got L people in the economy. There’s population growth — I’ll come back to that. The main decision in this economy is how you take your number of people and divide it into production workers versus researchers. That’s the allocative decision. We could:
Let markets decide.
Write a utility function and let the social planner figure out the optimal allocation.
Do a rule-of-thumb allocation — the one I’m going to follow here, and the easiest.
I’d encourage you, whenever you write down a model, just do rule-of-thumb allocations to start; you can do the optimal allocation or let markets allocate later. The thing that makes the model easiest to understand is some simple rule of thumb. Suppose we put a constant fraction s̄ — say s̄ is 10% — into research and 90% into producing goods. Then if you count equations and unknowns, the model’s closed and we can solve it. We can ask in particular: does this model generate sustained exponential growth at a constant rate, at least eventually?
[Student question.] Should I think about this rule of thumb as meaning skilled workers are unable to become unskilled workers?
In the simple model, there’s no such thing as skilled versus unskilled — there’s just a homogeneous labor. You could add skilled versus unskilled, and that would complicate the model, but the core result would still be the same. Like I’m forgetting about capital, I’m forgetting about human capital as well. In richer models — I’ll show you one at the end — I incorporate human capital. But for the simplest model you don’t need it, so I’ve left it out.
Remember when I said income per person grows at 2% per year — that’s about little y rather than big Y. In many growth models, we use lowercase letters to denote per capita variables. Little y is income or output per person. If you use my allocation, output per person depends on the stock of knowledge raised to some power times 1 − s̄.
[Student question.] I had a quick question on how to think about implementation costs within innovation. It seems a lot of implementation of new ideas are rival, and I’m struggling to think about something like calculus, which can be instantly transmissible to anyone who wants to use it, versus something like a new semiconductor innovation, which less developed countries wouldn’t be able to necessarily implement.
Even with calculus, it’s not like you show me a calculus book and I suddenly know how to do it. There’s a bunch of human capital — education — that has to be developed. It’s absolutely true that using ideas can require scarce resources. Imagine we’re making the COVID vaccine. It requires an incredibly sophisticated biotech factory and chemists to make it. Just because it’s technologically possible for many people to use the design simultaneously, doesn’t mean it’s not constrained by the scarce factors that are complementary to implementing it. In the simple model, those considerations are left out, but in the real world they’re definitely important.
[Student question.] Could you think about them being included in either β or σ here — just for conceptualization within the simple model?
I don’t think so. I think they’re different. Implementation is about rival stuff, and the φ in the production of ideas feels different to me. You’d have to complicate the model rather than use this one. But the first equation — income per person depends on the stock of ideas — Romer’s Nobel Prize is already there.
If we want the growth rate: on a balanced growth path, Ȧ/A is going to be constant. Whatever that constant is — along a balanced growth path, you can solve the idea production equation Ȧ = R·A^(−β) to get that A* (where the star denotes the balanced growth path) is some constant × R^(1/β). Where do ideas come from? From people. In the long run, the stock of knowledge is proportional to the number of people raised to some power, where the power is the inverse of the rate at which ideas are getting harder to find. A big β says ideas are getting hard to find quickly; a small β says they’re not getting as hard to find.
Now we put these two equations together, substitute the second into the first, and you get two useful results.
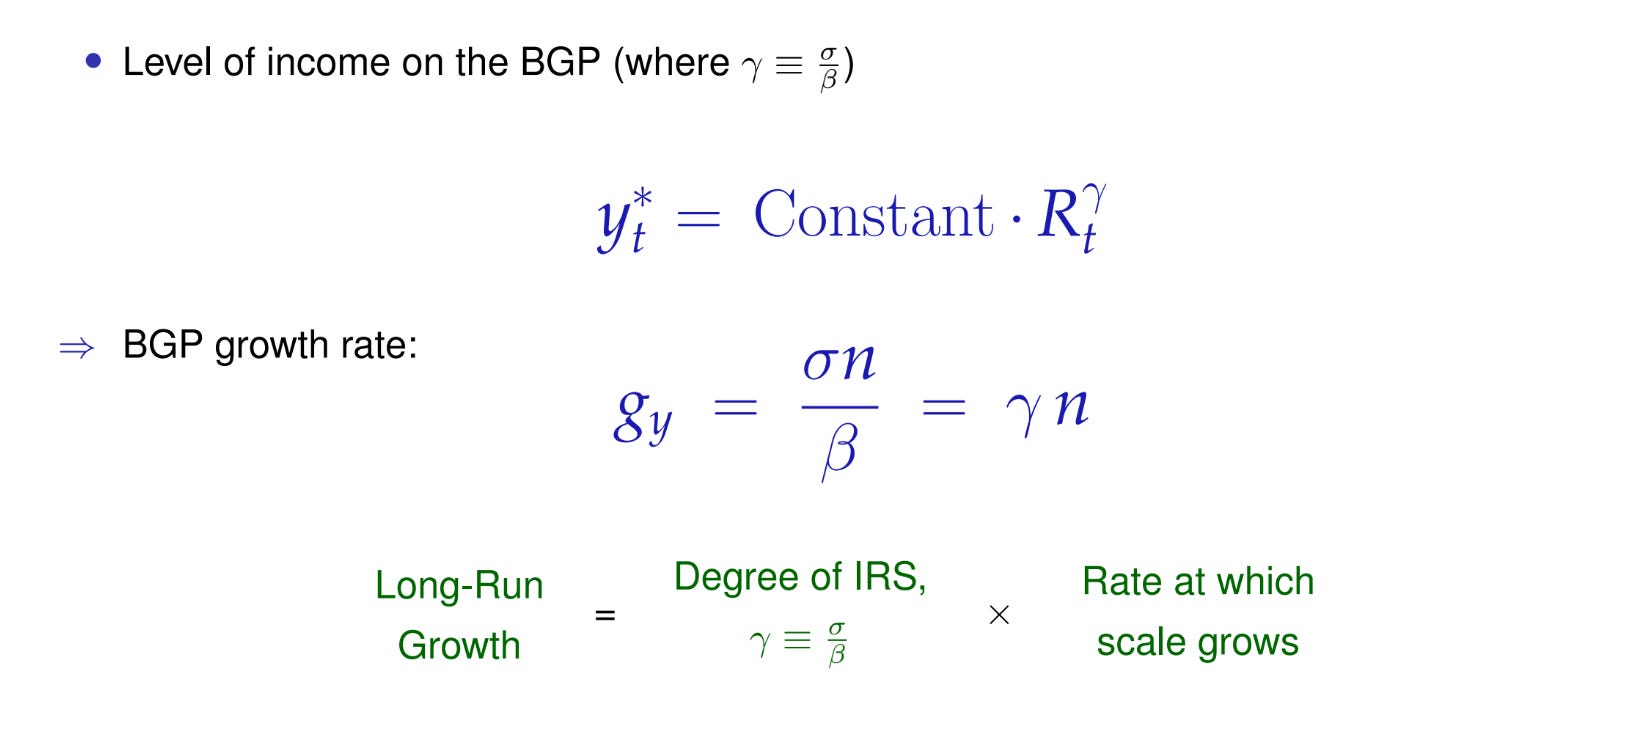
The first is that income per person is some constant × R^γ, where γ is my notation for σ/β. γ is a key measure of the degree of increasing returns to scale.
Notice what this equation says: income per person depends on the total number of people. Why? Income per person depends on the stock of ideas. The stock of ideas depends on the number of people. And we’re off and running.
Let me jump ahead quickly.
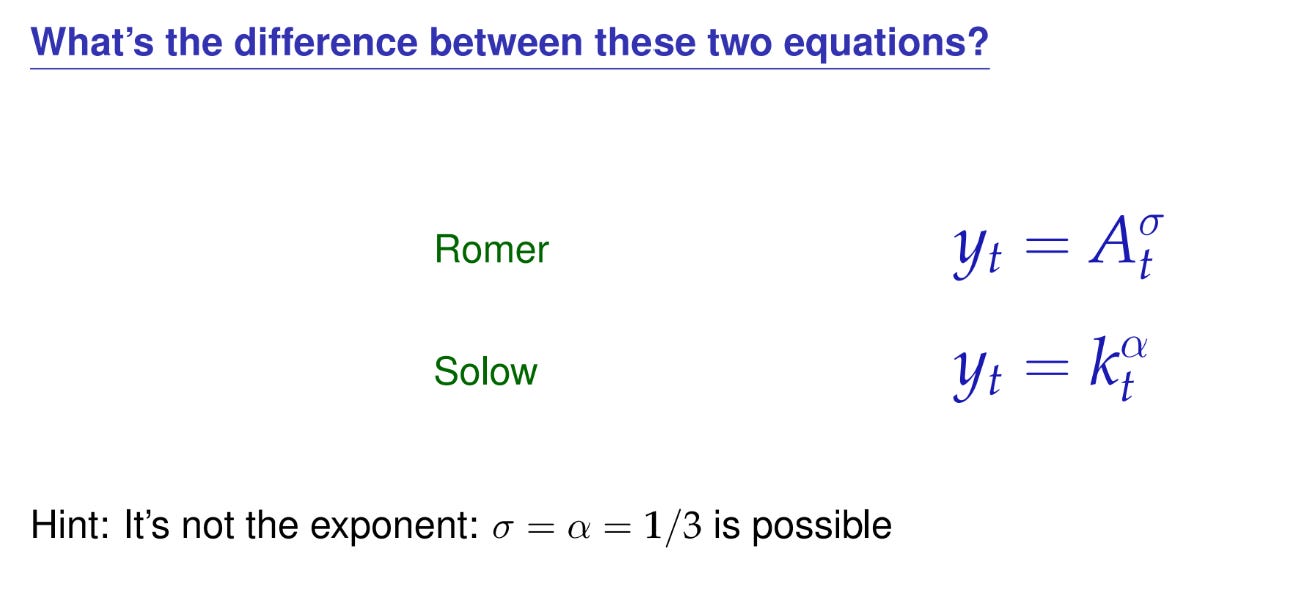
The equation I just derived says income per person depends on A to some power. The Solow model would say income per person depends on k to some power. Suppose I make both powers ⅓: α is ⅓ and σ is ⅓. The Solow model fails to deliver exponential growth, but the Romer model succeeds. Why? It has to do with the key difference between these two letters. A is the aggregate stock of ideas, and k would be capital per worker or per person. This is the nonrivalry of knowledge: each person benefits from every idea we create, whereas with machines you need a machine for every person.
Output per person depends on the number of ideas; the number of ideas depends on the number of people; so output per person depends on the number of people. If you take growth rates of this equation — logs and derivatives — the growth rate of output per person is the growth rate of the number of researchers × γ. So γn, where in the long run the number of researchers grows with population growth.
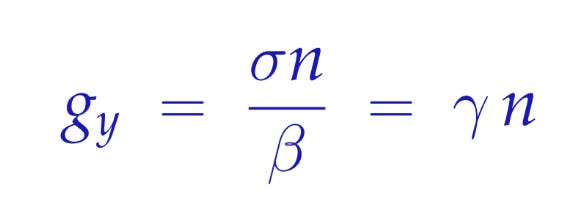
What this last equation says is the growth rate of income per person in the long run is a constant. This constant could be 2%: maybe n is 1% and γ is 2. I’ve given you a model that could give us constant exponential growth for 150 years. It has some interesting features — namely, population growth is important. If the population growth rate were 0, the exponential growth rate would be 0. We wouldn’t grow.
Why is population key? There are two ways to see it. The first is a narrow mathematical way. Romer’s key insight is that ideas are infinitely usable, and that gives rise to increasing returns to scale. What does increasing returns to scale mean? Bigger is more productive. Population growth makes us bigger, and the degree of increasing returns to scale turns the bigness of the population into per capita income. The growth rate is the product of the degree of increasing returns to scale, γ, × the rate at which scale is growing. The degree of increasing returns to scale is the ratio of how important ideas are in producing goods, σ, to the rate at which ideas are getting harder to find, β. γ is an overall measure of increasing returns to scale, including goods and ideas.
The other interpretation is that people produce ideas. We need the stock of ideas to grow. Getting aggregates to grow is easy; Solow taught us how. People produce ideas, so the more people, the more ideas. People produce computers, so the more people, the more computers. But it’s computers per worker that matters for productivity, whereas with ideas it’s the total stock. The COVID vaccine, calculus, or faster computer chips — you invent it once, eight billion people benefit.
You add one new idea and you can make an unlimited number of people more productive or better off, because the ideas are infinitely usable. Income per person depends on the total stock of knowledge, not ideas per person. It’s easy to make aggregates grow — population growth makes aggregates grow. That’s the essence of how Romer’s insight of nonrivalry leads to growth in a way that other models don’t.
Let me turn to this paper with Nick Bloom, John Van Reenen, and Mike Webb: Are ideas getting harder to find? This paper provides evidence for the view of growth I laid out. It documents a new stylized fact: there’s a robust sense in which ideas are getting harder to find.
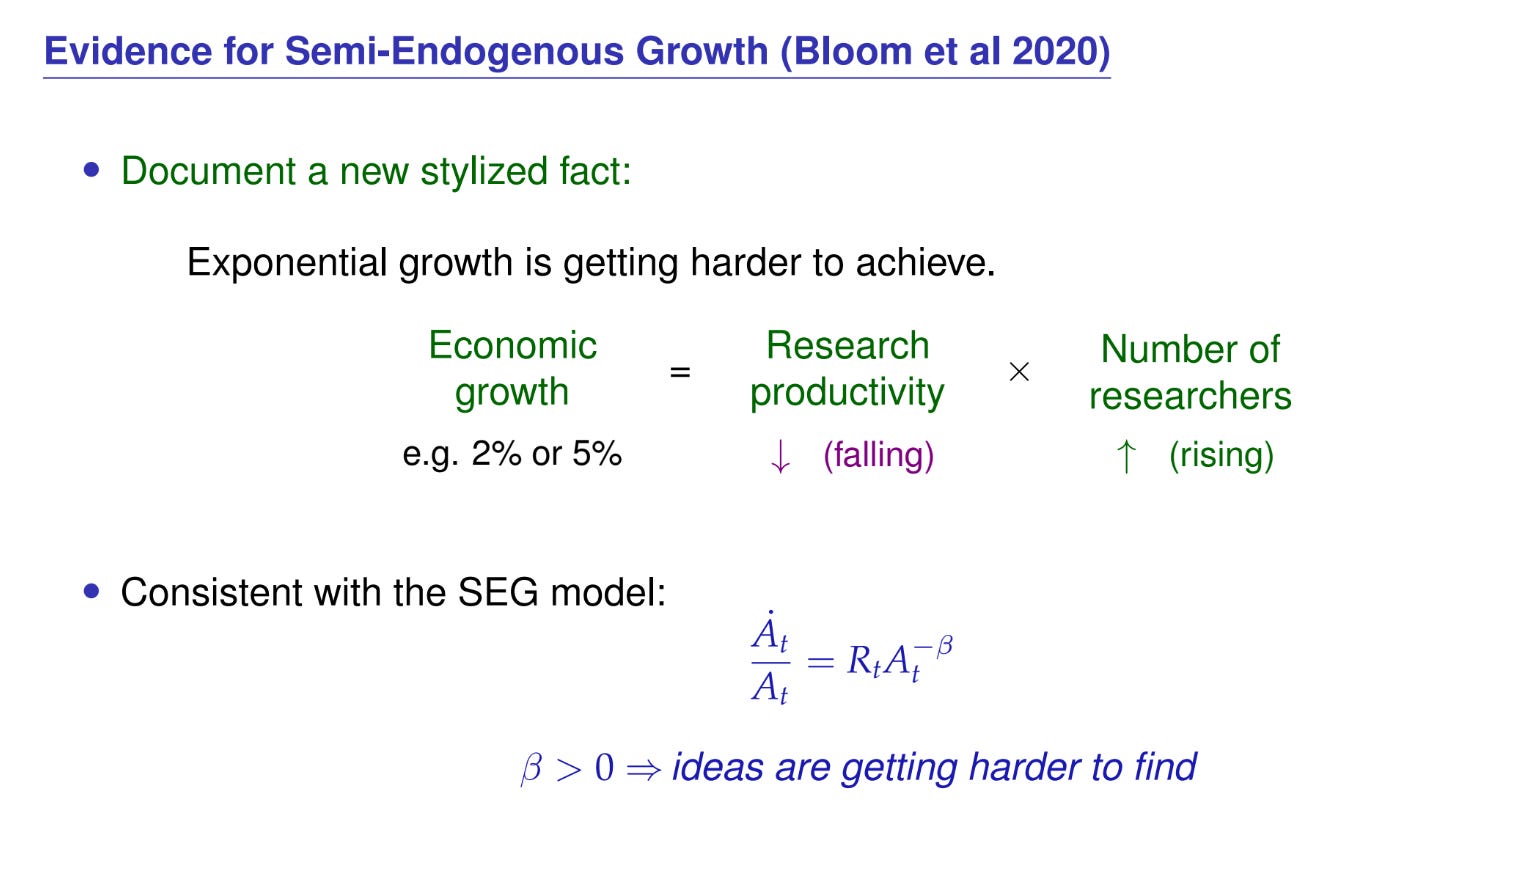
There’s a word equation that many growth models have that says the growth rate equals the number of people looking for ideas times their research productivity times the rate at which they turn ideas into growth.
In this paper, we say, “Economic growth and the number of researchers are pretty easy to measure. So we can do growth accounting with the idea production function.” We measure growth and the number of researchers, and we can infer research productivity — the total factor productivity (TFP) of the idea production function — as a residual.
When we do that, everywhere we look — agriculture, Moore’s law, health innovations — economic growth is pretty stable or maybe even declining slightly. But the number of researchers is rising incredibly quickly. This says that research productivity — the rate at which we turn people into economic growth — is declining very robustly. That’s a sense in which ideas are getting harder to find. The way I wrote down the growth model is exactly this: growth is on the left-hand side times the number of researchers, and the TFP of the idea production function is A^(−β). For β > 0, ideas are getting harder to find. The evidence we document in lots of different places very much looks like the model I wrote down.
Let me show you some of that evidence. First, for the aggregate economy, what does TFP growth — the blue line — look like?
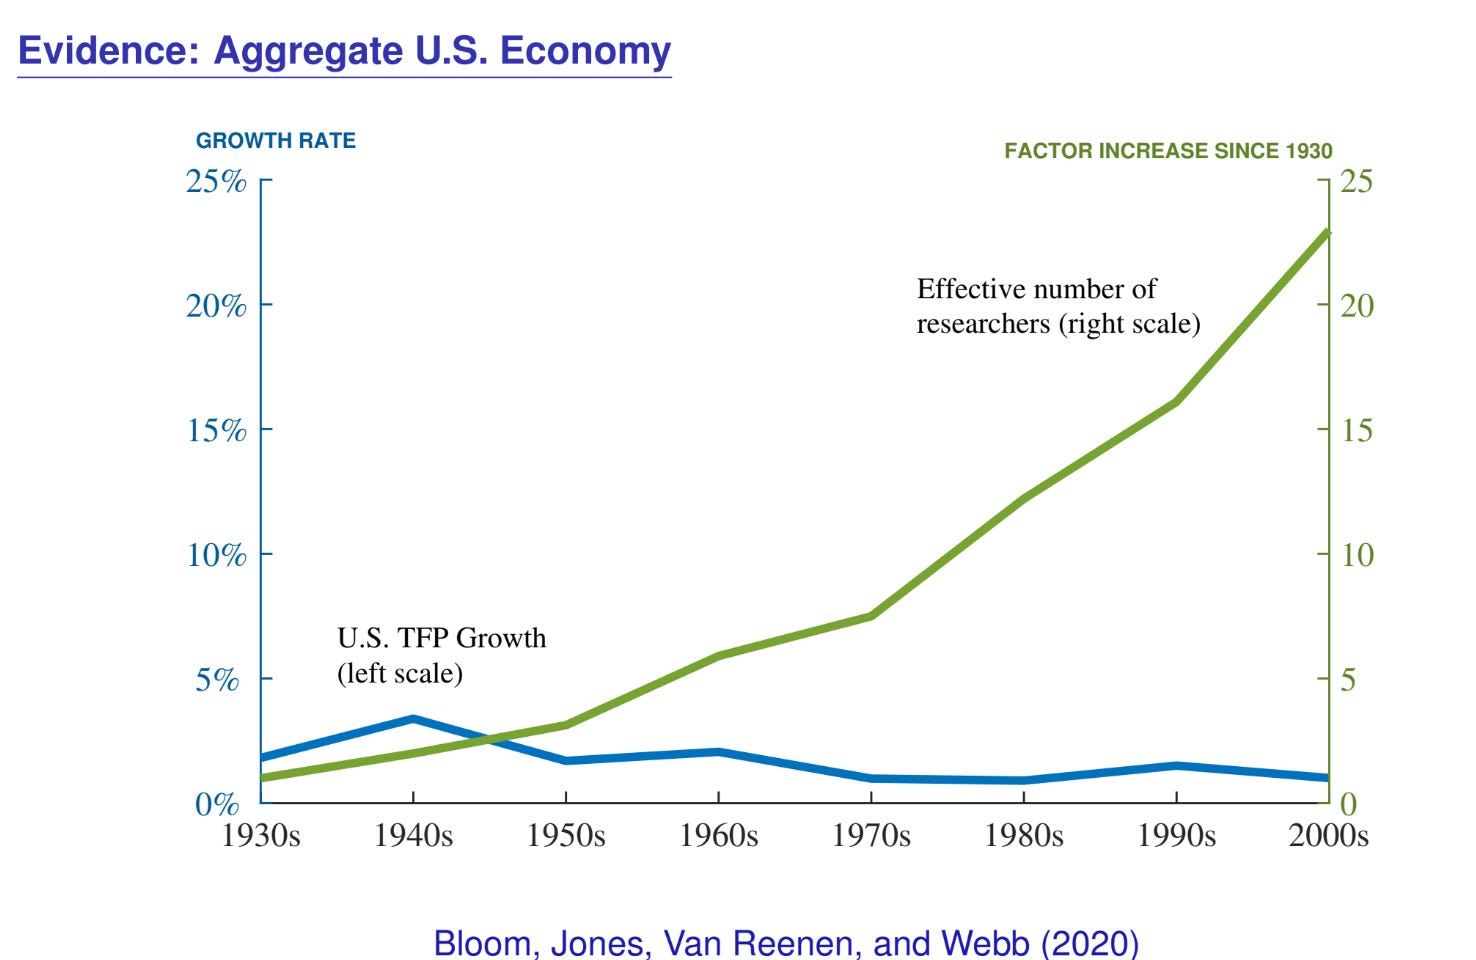
It was high in the ‘40s, ‘50s, and ‘60s, and it’s been declining ever since.
What about the number of researchers? That’s on the right-hand axis. If research productivity were constant, growth rates would be proportional to the number of researchers — the original Romer, Aghion-Howitt, and Grossman-Helpman models said that. They assumed research productivity was constant. What we’re showing is that research productivity is falling. That’s why I’ve made the scales similar: the model with constant research productivity says these two lines should lie on top of each other. Instead, growth is flat or declining, and the number of researchers has grown by a factor of 23 in the United States since 1930. If research productivity were constant, growth rates would have grown by a factor of 23, but they haven’t. Research productivity at the aggregate is declining — by more than a factor of 23, because the growth rate is declining.
My favorite example is Moore’s law. Moore’s law is a straight line on a log scale, very much like US income per person.
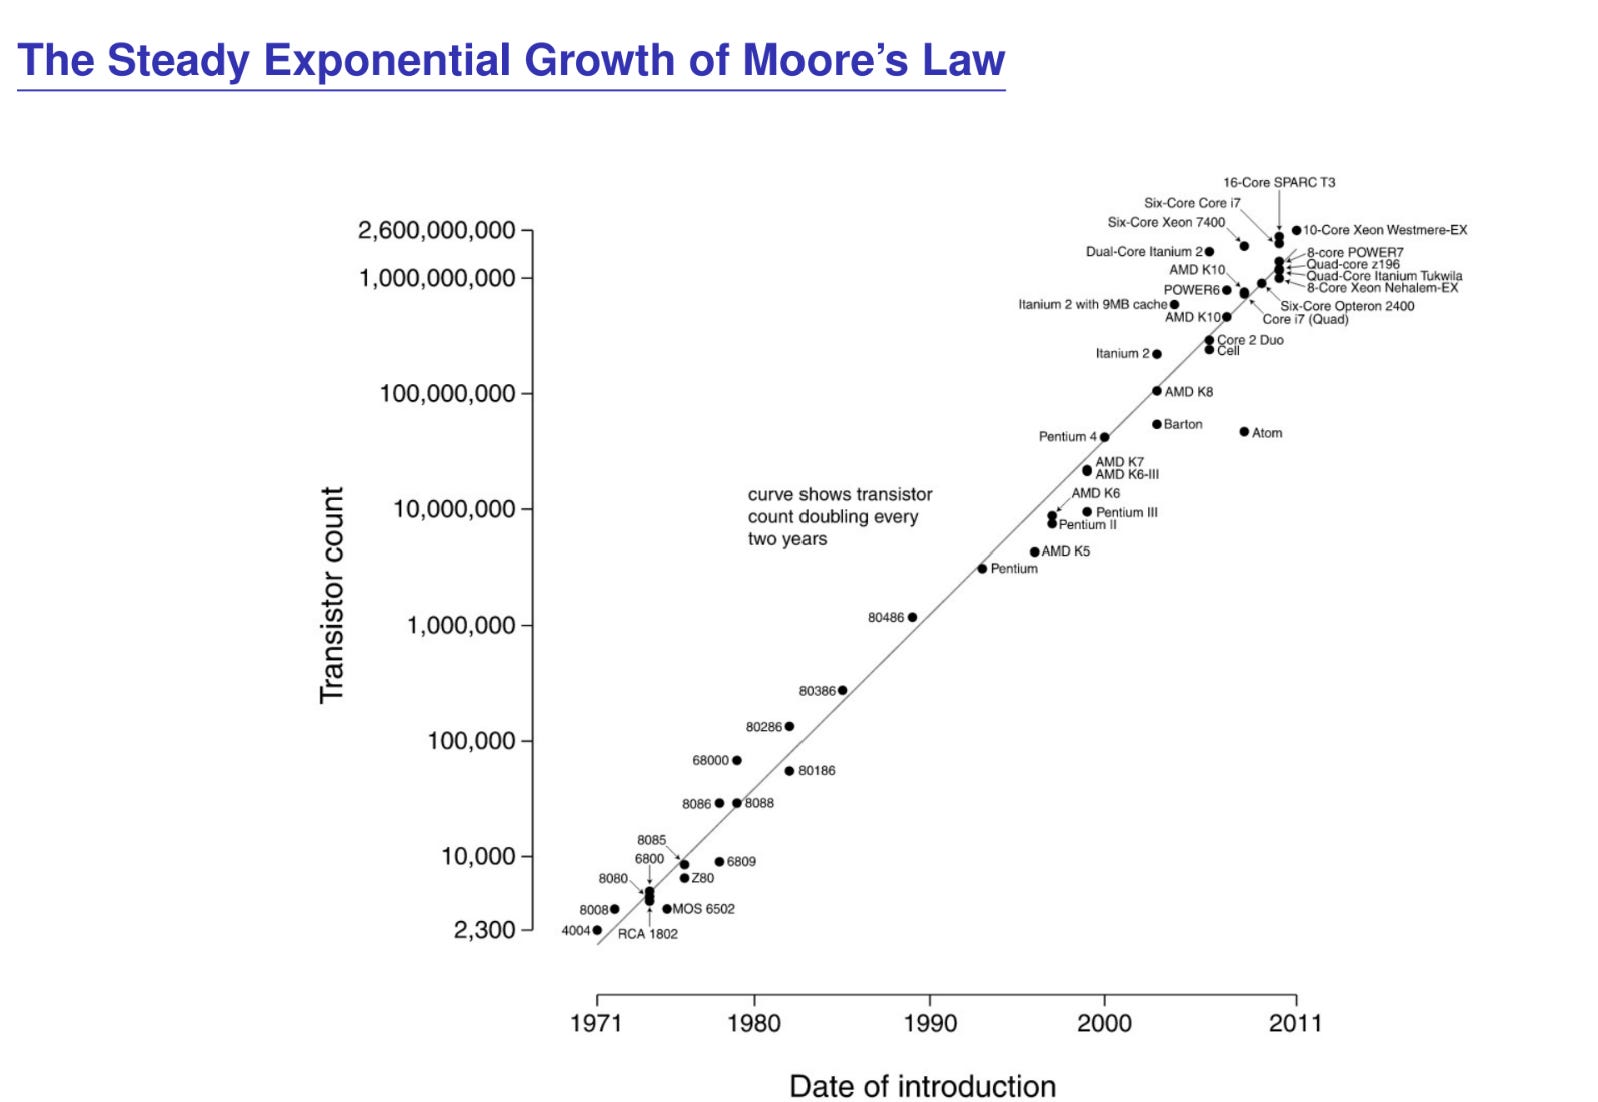
It’s been behind most of the rapid growth we’ve had in the last 25 years. It says the number of transistors we fit on a computer chip doubles every two years. For the last 50 years that’s been true.
Where does Moore’s law come from? Notice: constant slope on a log scale — constant exponential growth, doubling every two years. The growth rate is 70/2, or 35% per year. Moore’s law is not a law of nature — it doesn’t happen regardless of what we do. It’s viewed as a target by the industry, and we’re throwing more resources at these problems to stay on the line. If you measure the number of researchers devoted to pushing Moore’s law forward — Intel, AMD, Samsung, TSMC, and ASML, but also IBM, AT&T, and Motorola historically, or National Semiconductor and Fairchild Semiconductor in the ‘70s — it’s growing incredibly rapidly.
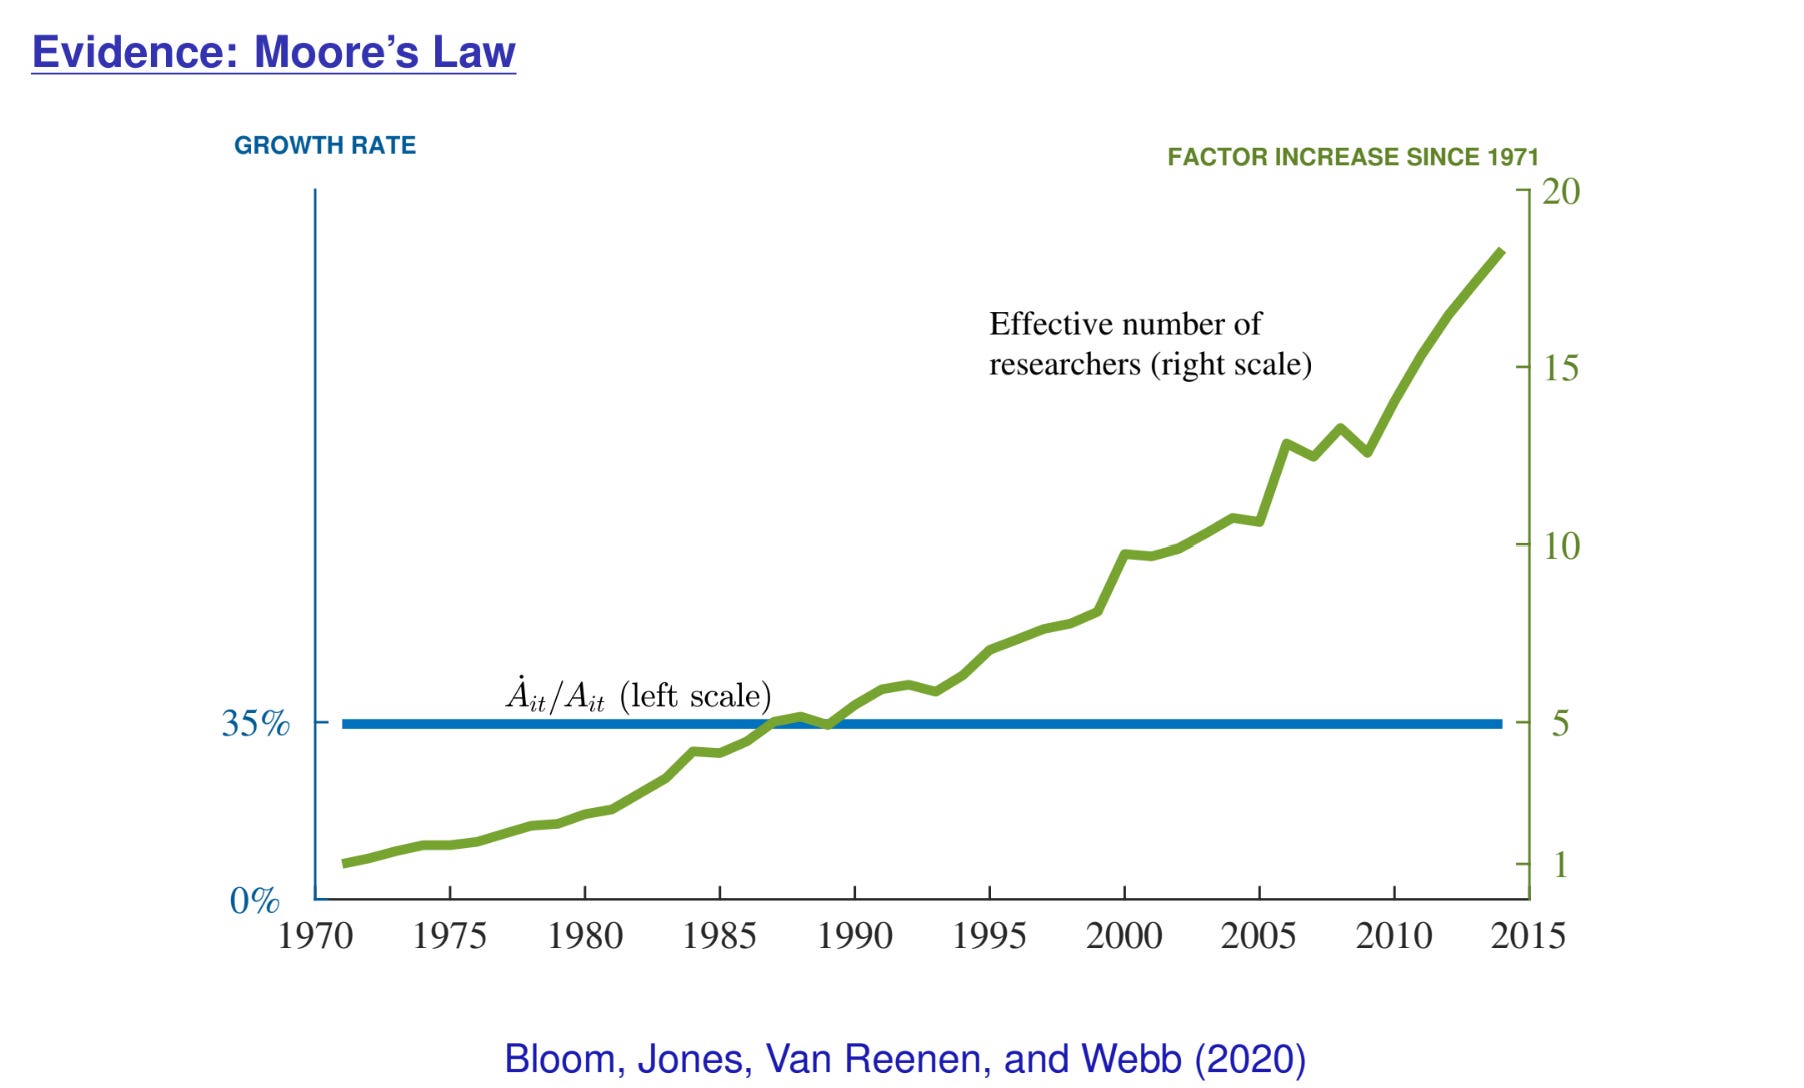
It takes about 18 times the number of researchers today to generate the doubling of chip density as it took in the ‘70s.
Again, growth is constant, the number of researchers is rising like crazy — so research productivity is falling and ideas are getting harder to find. We have to run faster — throwing ever more resources at these problems — to maintain constant growth. That’s what the growth model I started with says. We look at agriculture, medical innovations, Compustat data, the aggregate economy — you see this fact everywhere. We haven’t found a place where you don’t. You have to double researchers every decade to maintain constant growth. If we ever stopped doing that, growth would presumably slow down. That’s what the model says.
Let me do some growth accounting — this gets at the earlier question. I’ll give a broad overview. I can add capital, human capital, and misallocation, M, and do growth accounting with a model that includes the idea production function.
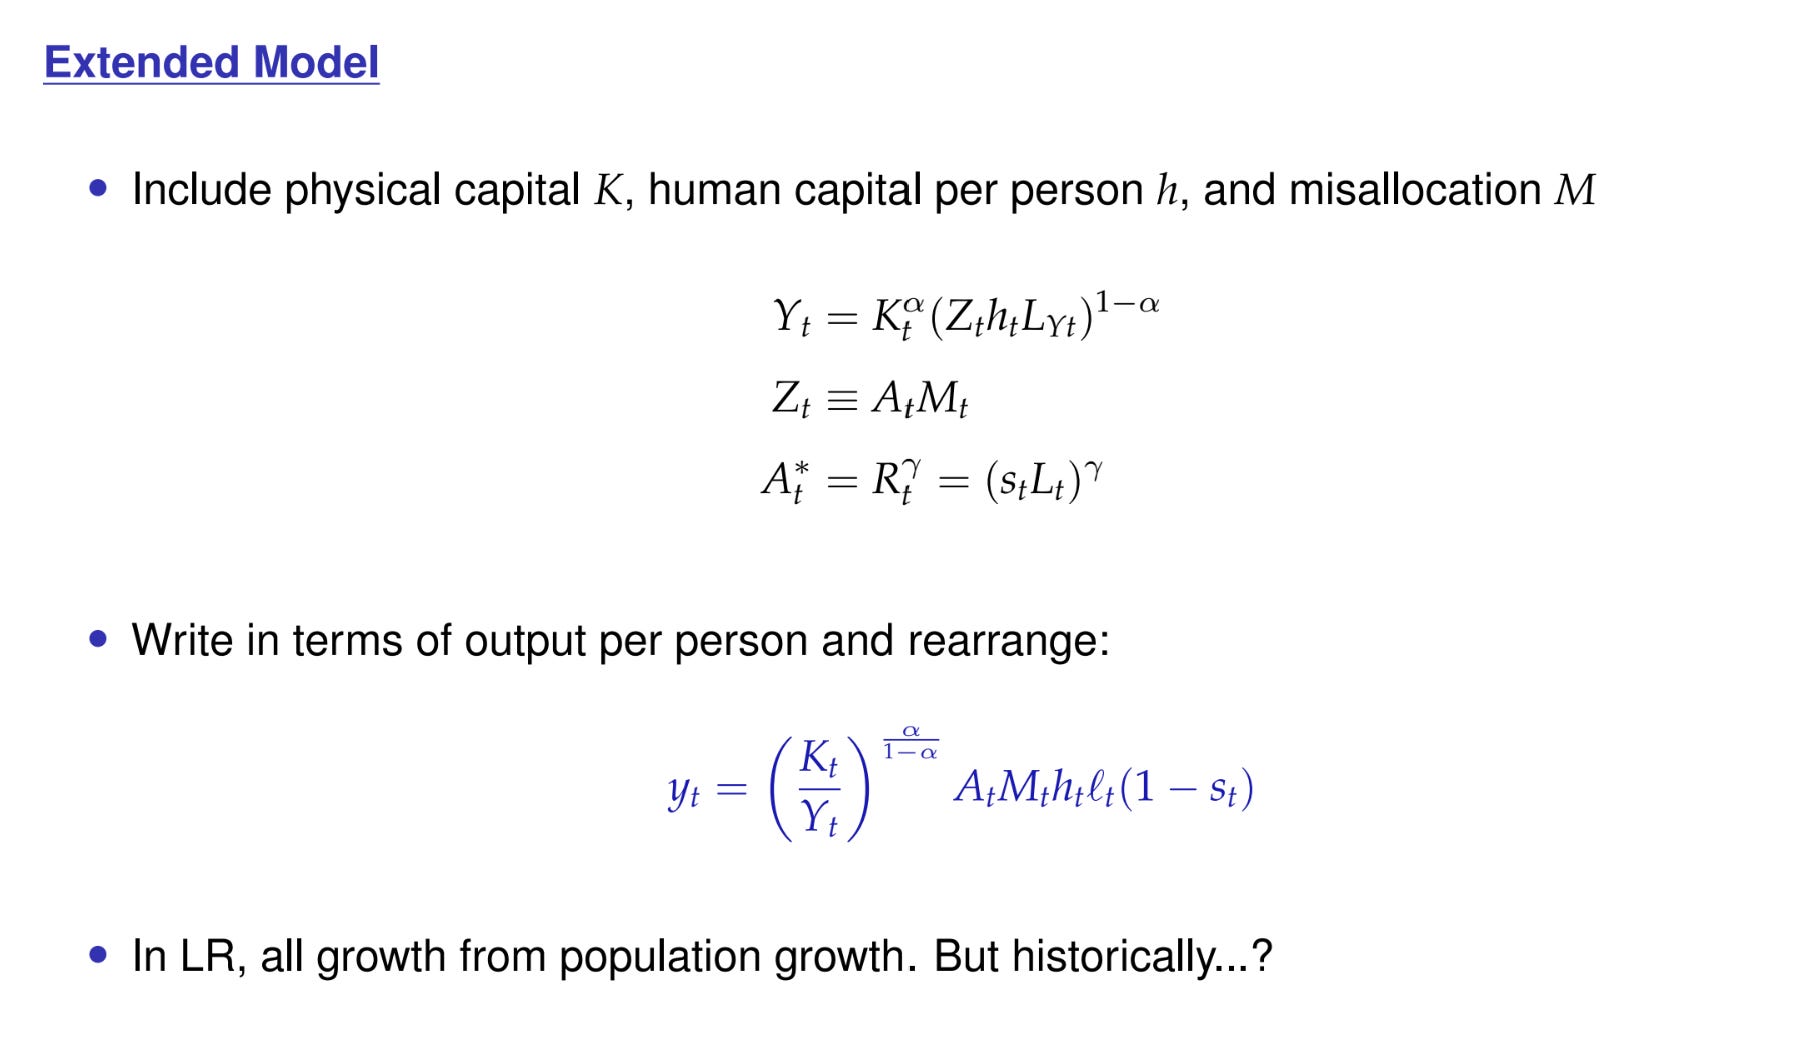
I’m using the balanced growth path version, where A = R^γ and R = sL — s is the fraction of people engaged in research, and L is the total population. When you write down this richer model, in the long run all growth is proportional to population growth, so it’s γn again, even with all these other ingredients. But along a transition path you can grow faster than γn.
Historically, how does growth accounting look in this richer model?
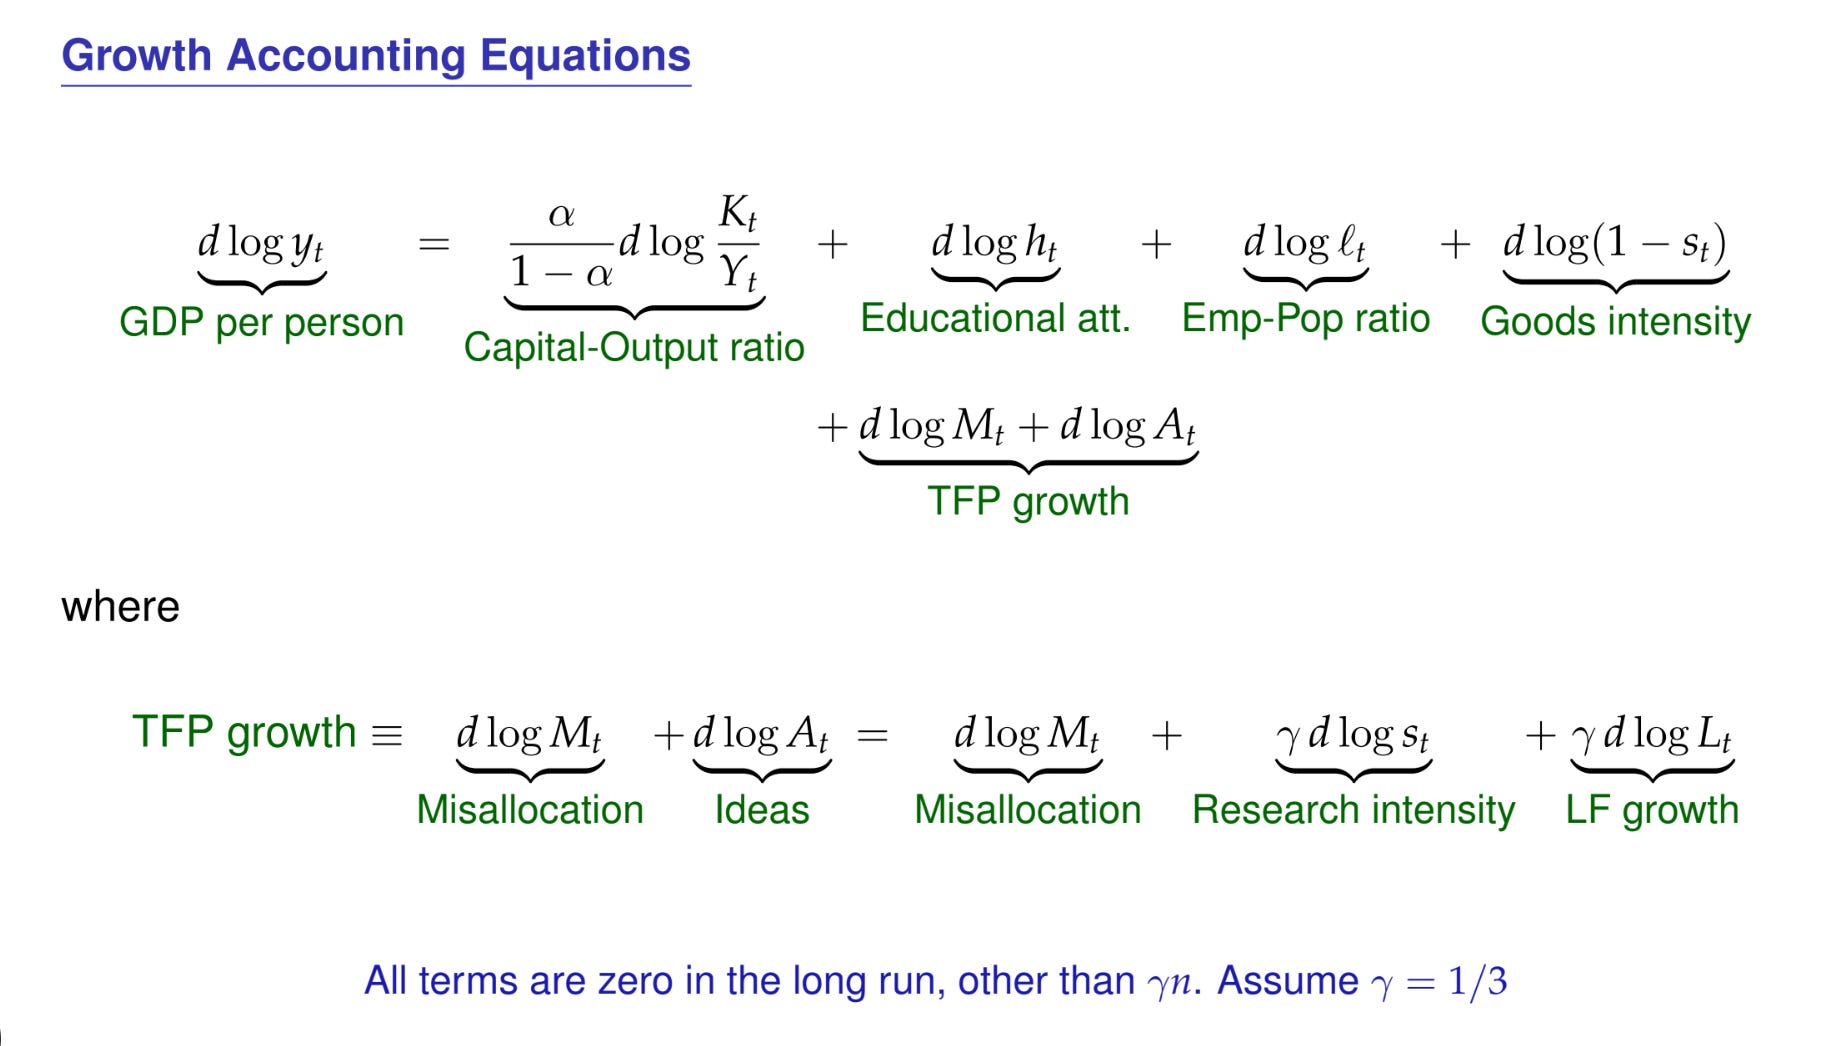
I’m writing out the terms. There is:
A capital-output ratio,
Educational attainment,
The employment-population ratio — what fraction of people are working; and then,
TFP growth.
TFP growth in turn has a misallocation and an idea term. The idea term has the research intensity and population growth.
In the long run, all of these terms, other than the last one, are zero:
Educational attainment — what fraction of your time you spend in school — is bounded by 100%.
What fraction of your population you put in research — the s variable — is bounded at 100%. It has to stop growing eventually.
But historically, s has been rising, and educational attainment has been rising. Historically, not all growth was due to population growth.
Let’s do the accounting. What you get is summarized in these pie charts:
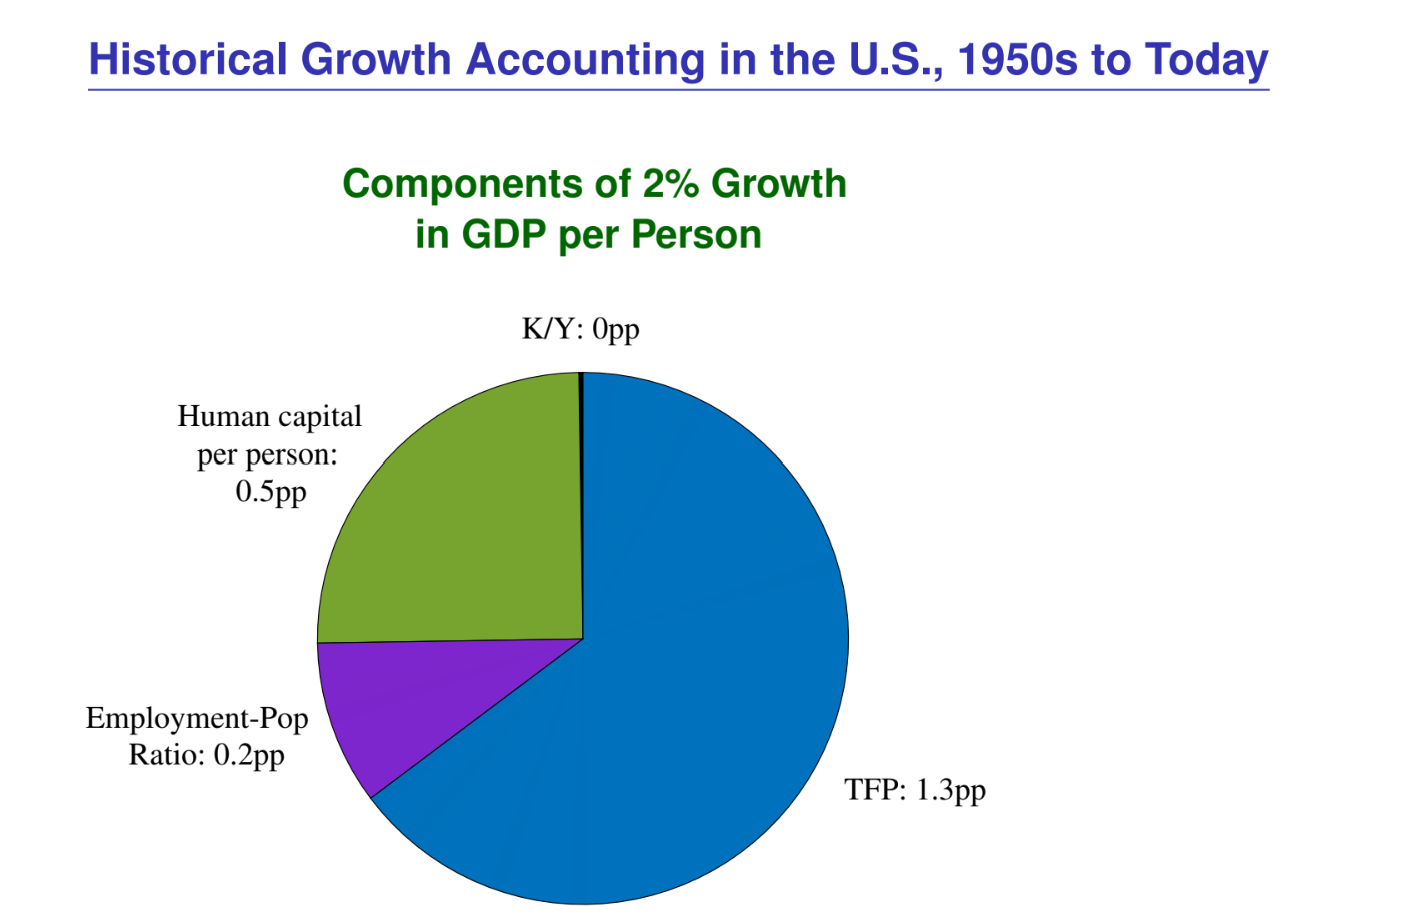
The capital-output ratio is pretty constant.
Human capital per person rises at about a year per decade in the 20th century. Each year [of additional education], labor economists tell us, raises wages by 6%. It’s actually risen by less than a year per decade, so each decade we’re adding 5% to wages. Wages are output per person. If you divide by 10 you get 0.5% per year. Rising educational attainment accounted for a quarter of our 2% growth in much of the 20th century. But it’s already leveling out.
Similarly, rising female labor force participation, the employment-population ratio: 2 percentage points. But the employment-population ratio has to level out at some point — it’s already leveled out.
These historical sources of growth are going away.
TFP growth is the residual, 1.3.
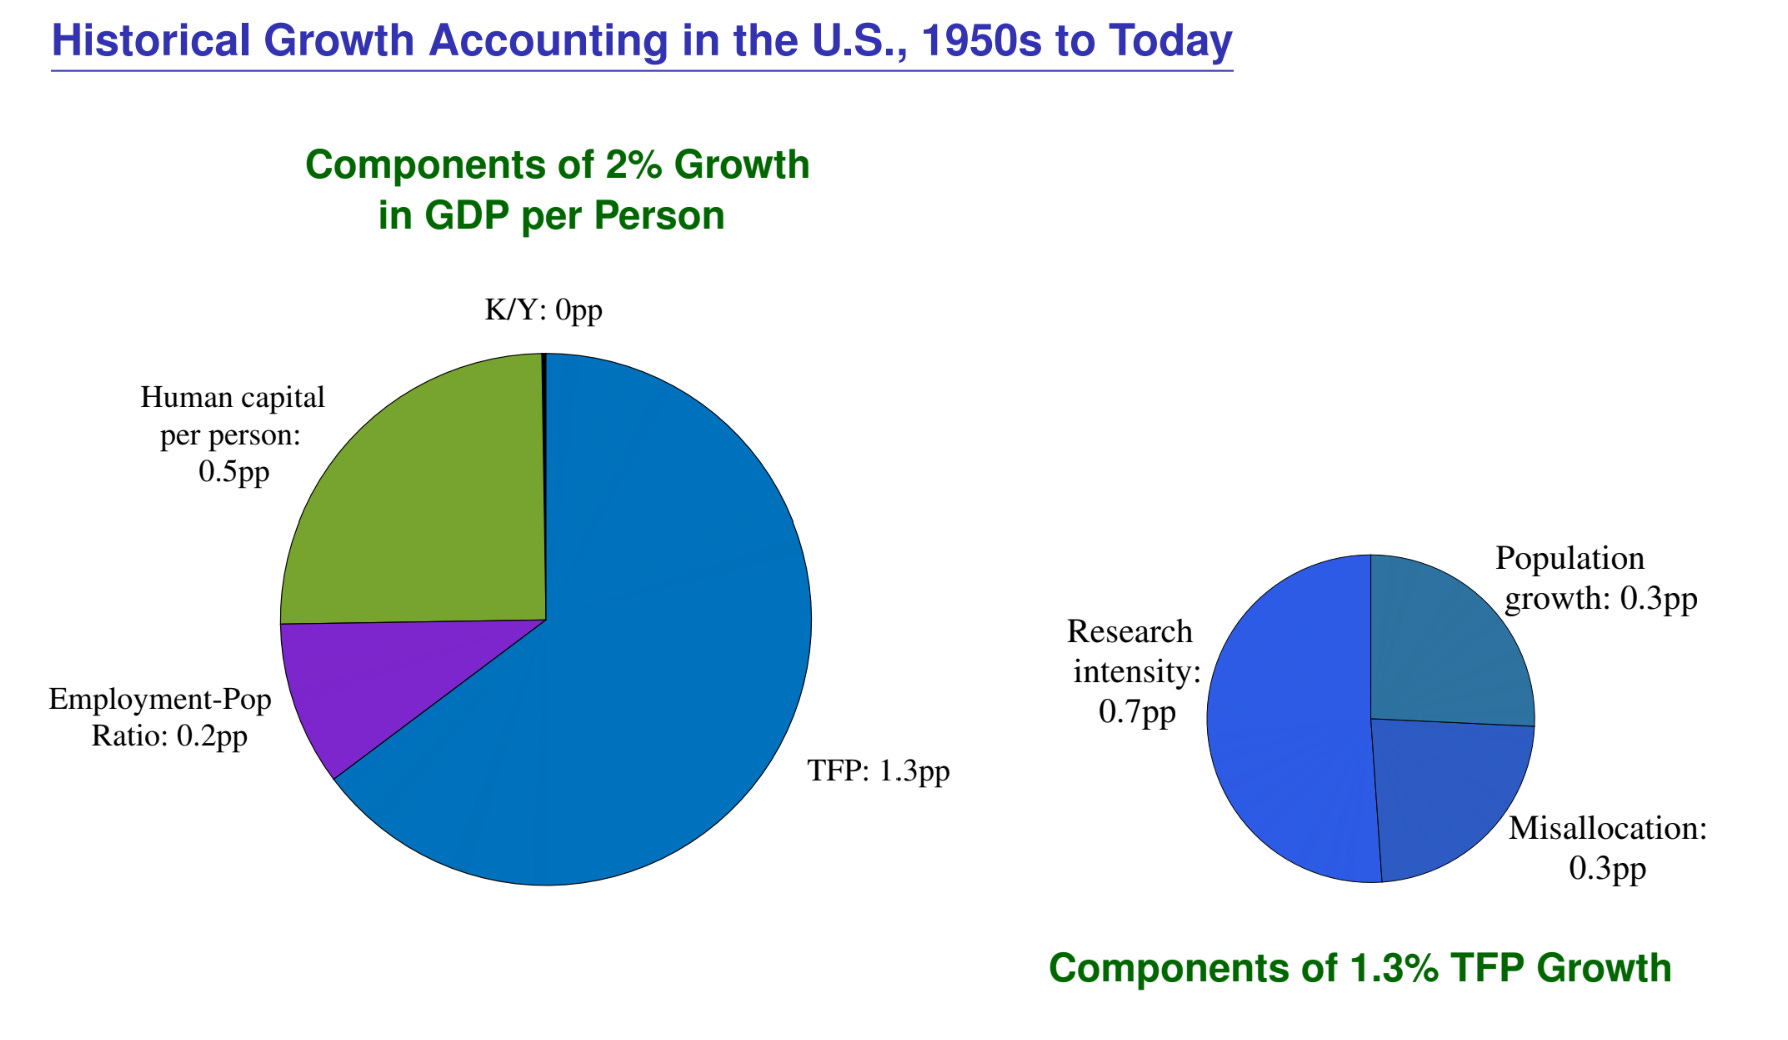
That’s due to research intensity, declining misallocation, and population growth. Rising research intensity is half of TFP growth, but it can’t rise forever. Declining misallocation — I make up this number from a paper on the allocation of talent with Chang-Tai Hsieh, Erik Hurst, and Pete Klenow. But if you get rid of all misallocation, you can’t get anything else. The population growth component, since the ‘50s — my estimate is it’s only 15% of growth, 0.3 percentage points.
What that means is when all these other sources come to an end — human capital is already slowing down, employment-population ratio has already come to an end, research intensity is still rising, misallocation is hopefully improving — population growth is the only source. There are lots of forces pushing down growth in the long run. Maybe our long-run growth is much slower than our historical growth.
The future of growth might be slower for various reasons — population growth is also slowing. It might be faster for two reasons. The rise of China and India. How many talented people in the ‘80s — because China and India were poor and far from the frontier — couldn’t push the frontier forward? Now that China and India are getting richer, that’s 2.5 billion people we can start throwing at these hard problems. AI is another: if machines can produce ideas, we don’t need people to produce ideas — maybe good things can happen.
Let me stop on that. These are great questions for future research.
How large is the degree of increasing returns to scale? I was assuming it’s a third, and I have some reasons for that, but I wish we had better estimates.
What is the social rate of return to research?
Better growth accounting to look at the long and variable lags through which increases in research translate into productivity growth in the future.
Automation has been ongoing for 150 years, but growth is slowing not rising: why?
AI and our economic future
I’ve written several papers on AI and I’m spending lots of time on this — it’s the most important thing happening right now. I have a paper called AI and Our Economic Future that summarizes the work I’ve done. These slides are loosely based on that.
The first paper I wrote was with Philippe Aghion and Ben Jones, called AI and Economic Growth. We identified two themes.
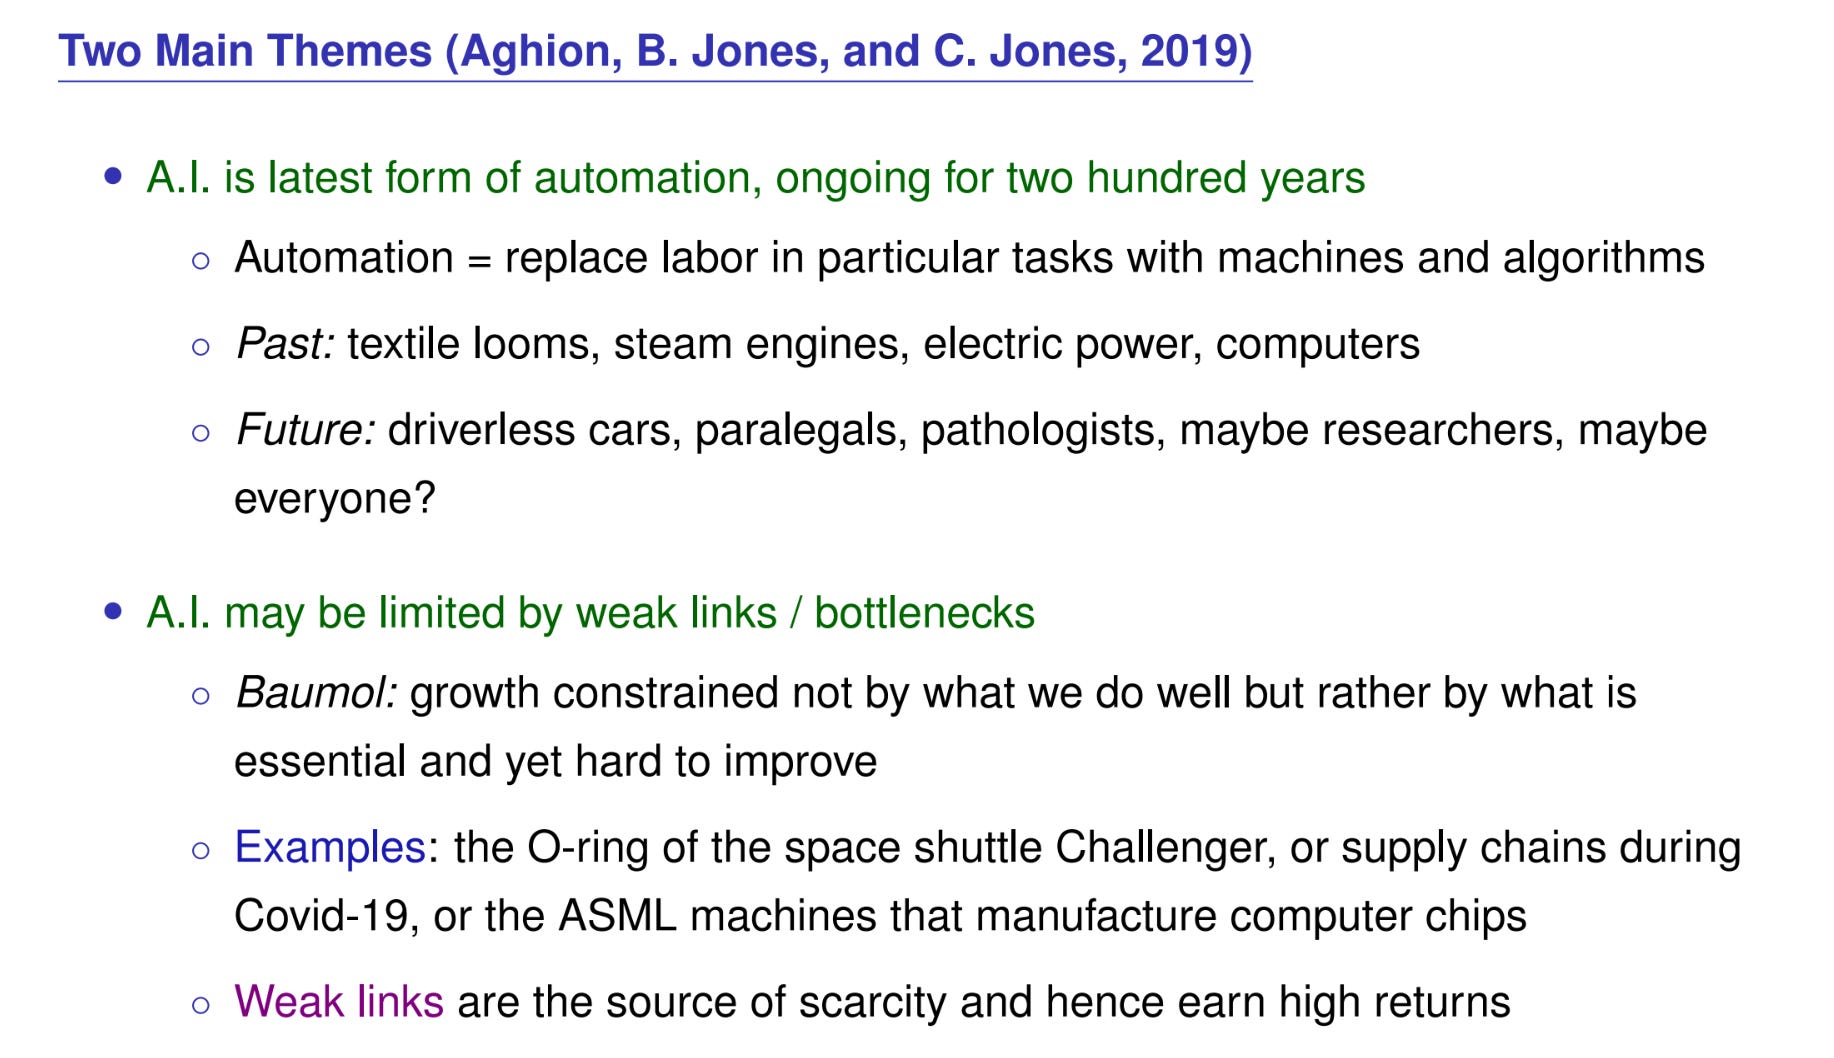
First, AI is the latest form of an automation process that’s been going on for centuries: the textile revolution, the steam engine revolution, electric power. Maybe we can look at history to learn something about what AI might do in the future.
The second important point is that AI may be limited by bottlenecks, weak links, or Baumol’s cost disease. In the early paper we talked about Baumol’s cost disease and bottlenecks; in my new paper I’m talking more about weak links, but we mean the same thing by all those phrases. Economic growth is constrained not by what we do well, but by the things that are both essential and hard to improve. It’s very much like Michael Kremer’s O-ring paper. The space shuttle Challenger explodes in 1986 because one $20 part fails. In a model with 5,000 parts, if one of them fails it can be disastrous, because of the weak-link problem — your production has an elasticity of substitution less than one. Everything has to go right or bad things can happen. Production functions feel that way. The computer chip manufacturers we talked about are like that. Weak links are the source of scarcity, and therefore earn high returns.
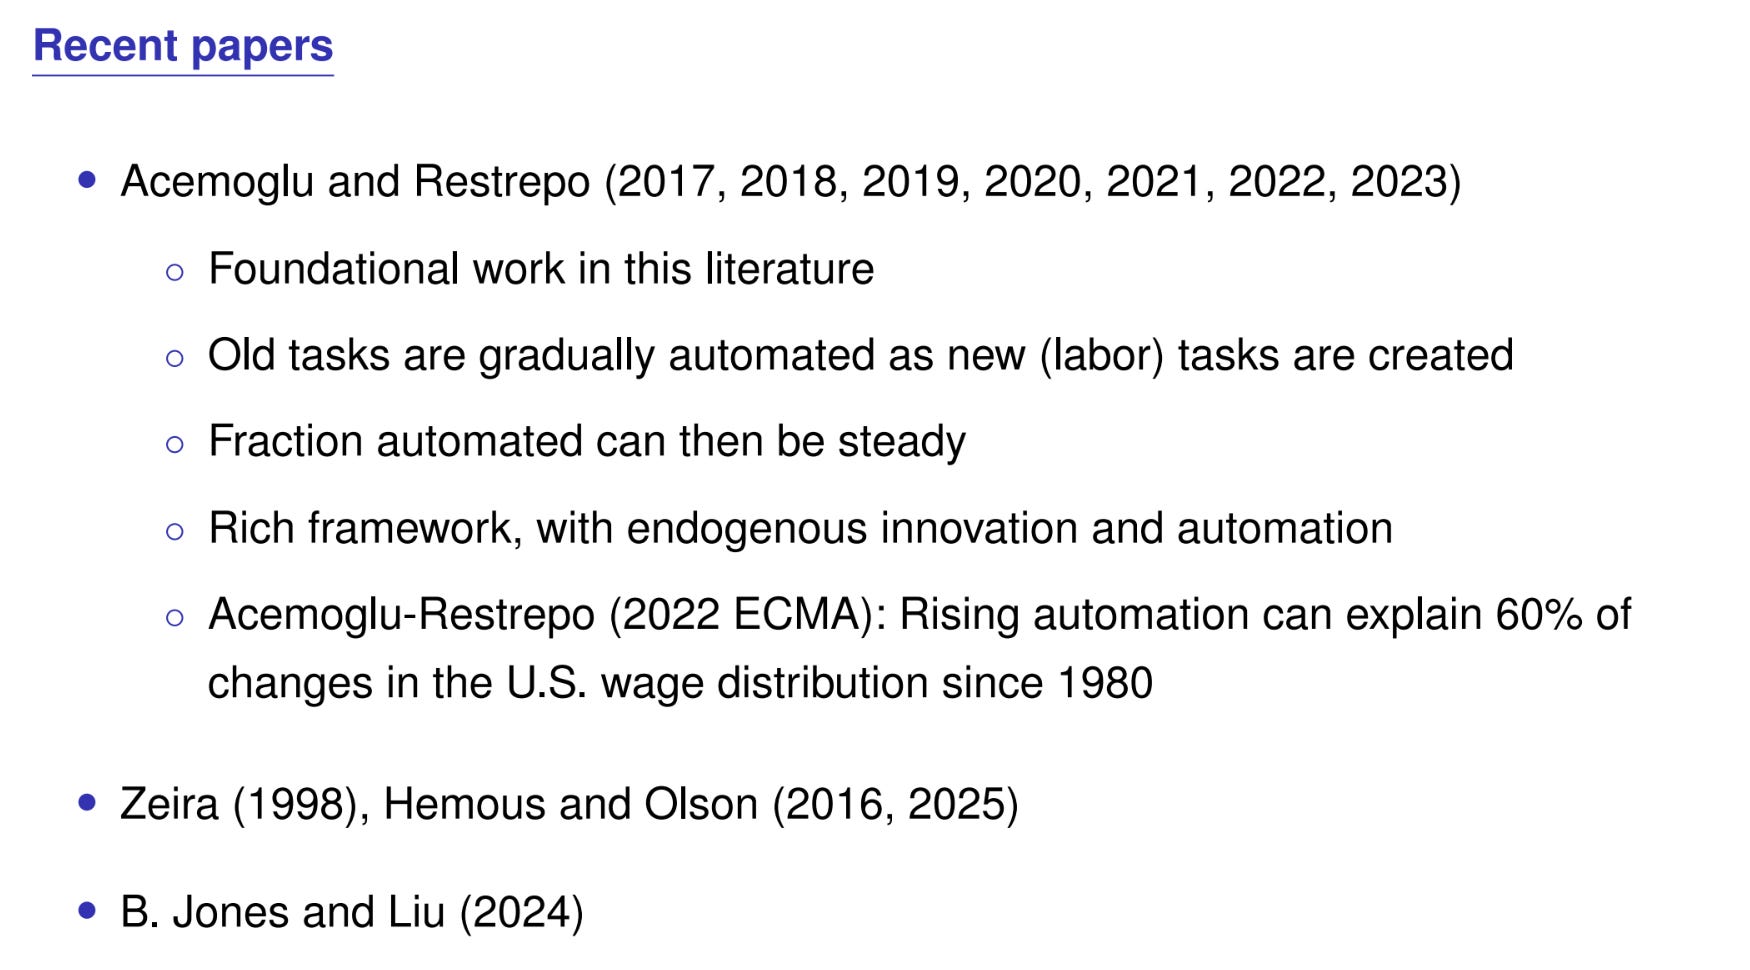
There are a ton of papers by Acemoglu and Restrepo — every year they write another top-five paper on automation and growth. Half of what I know about automation and AI I learned from their work.
There’s a foundational paper by Zeira.
A nice paper by Hemous and Olsen that was around very early on.
Ben Jones has done some work I’ll touch on.
Automation and Weak Links
First, let me show you the canonical model — the right combination of simple and insightful.
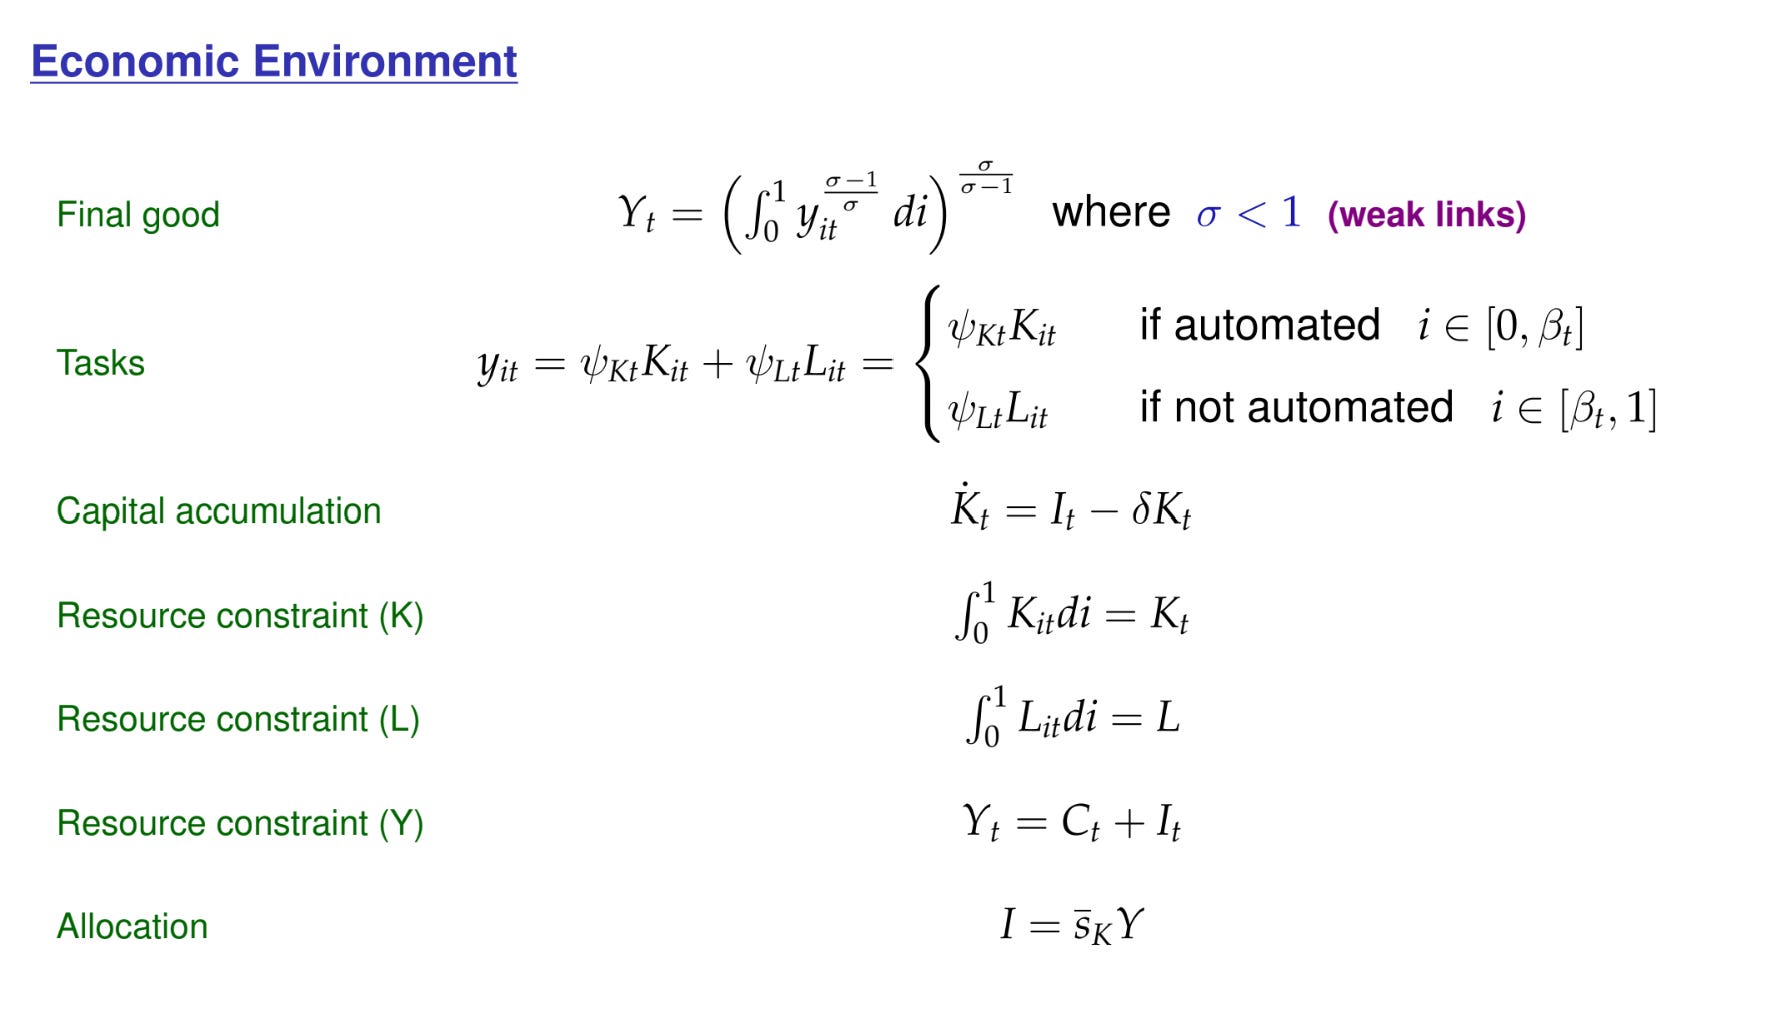
You’ve got a CES production function with elasticity of substitution less than one, σ < 1. That’s what we mean by weak links. Every input is essential: if any input is zero, output is zero, and if any input is infinite, output is finite. σ < 1 gives you that. The chain is only as strong as its weakest link. You don’t have to go to Leontief — σ < 1 is enough. Output is a combination of a continuum of tasks, yᵢₜ.
Each task can be produced with machines or with people as perfect substitutes. People have productivity ψ_L and machines have productivity ψ_K. In the paper with Chris we put the i’s there as well (ψ_Li, ψ_Ki) — different machines can be good or bad at different tasks. If the task has been automated — from 0 to β, where β is the fraction of tasks we’ve automated — then you produce with capital. If it hasn’t been automated, you’re not allowed to produce with capital; you haven’t figured it out yet, so you have to produce with labor and you get ψ_L⋅L. This implicitly assumes machines are sufficiently productive and cheap that you’d rather use machines — that’s an easy assumption to justify.
Capital accumulates.
You’ve got a fixed number of machines, K, that changes over time, but at a point in time it’s a stock you have to allocate across tasks.
You’ve got a given amount of labor to allocate across tasks. Y = C + I.
Investment, like Solow, is a constant fraction of output, so I don’t have to talk about prices if I don’t want to.
The model’s symmetric, so you’ll naturally put the same amount of capital and labor on each task, and the allocation is straightforward.
An important feature of this model is that it’s got both complementarity — the weak link, σ < 1 — and substitution in the production of tasks, with perfect substitutes. What gives rise to the richness of the predictions of these task models is this interplay between complementarity and substitution. If you allocate capital symmetrically across tasks, so from 0 to β you put K/β units of capital, and from β to 1 you put L/(1−β) units of labor on each task.
This production function — K/β units of capital, L/(1−β), on a β fraction of tasks.
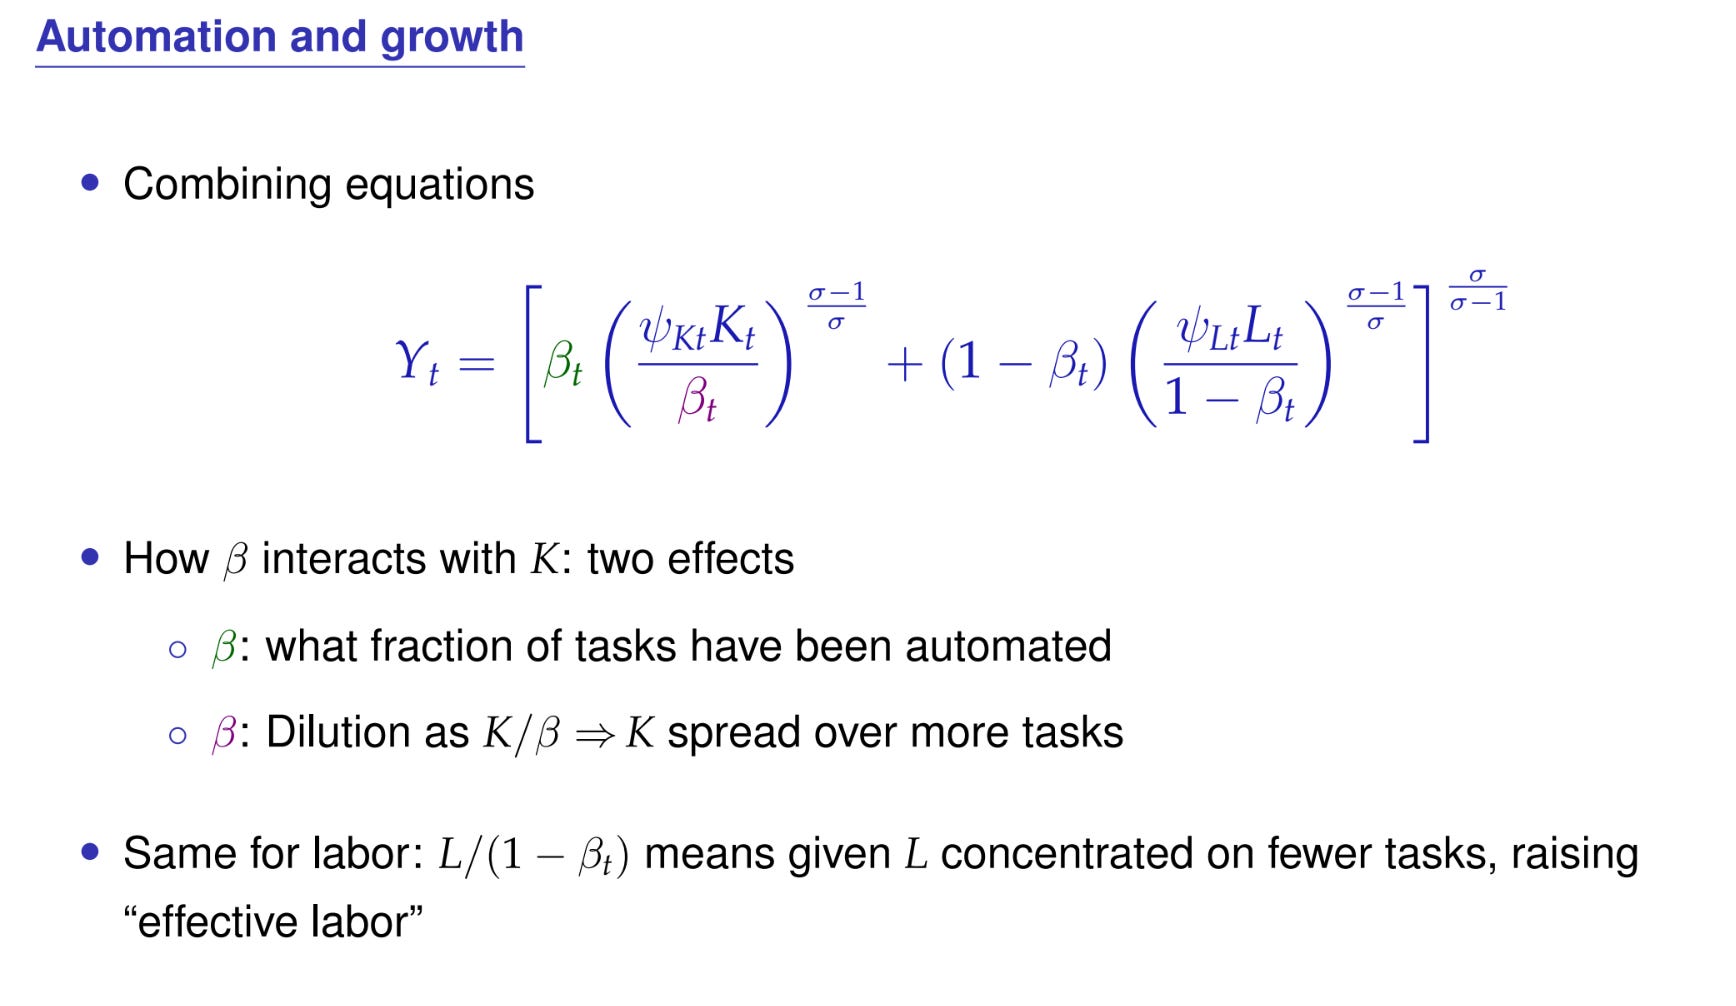
There’s a green β and a purple β. The purple β dominates when σ < 1. There’s this dilution effect: as you automate more tasks, your given stock of capital gets spread more thinly, and your given stock of labor gets concentrated. Labor per task goes up, capital per task goes down.
You can collect these βs and write this as a reduced-form CES production function.
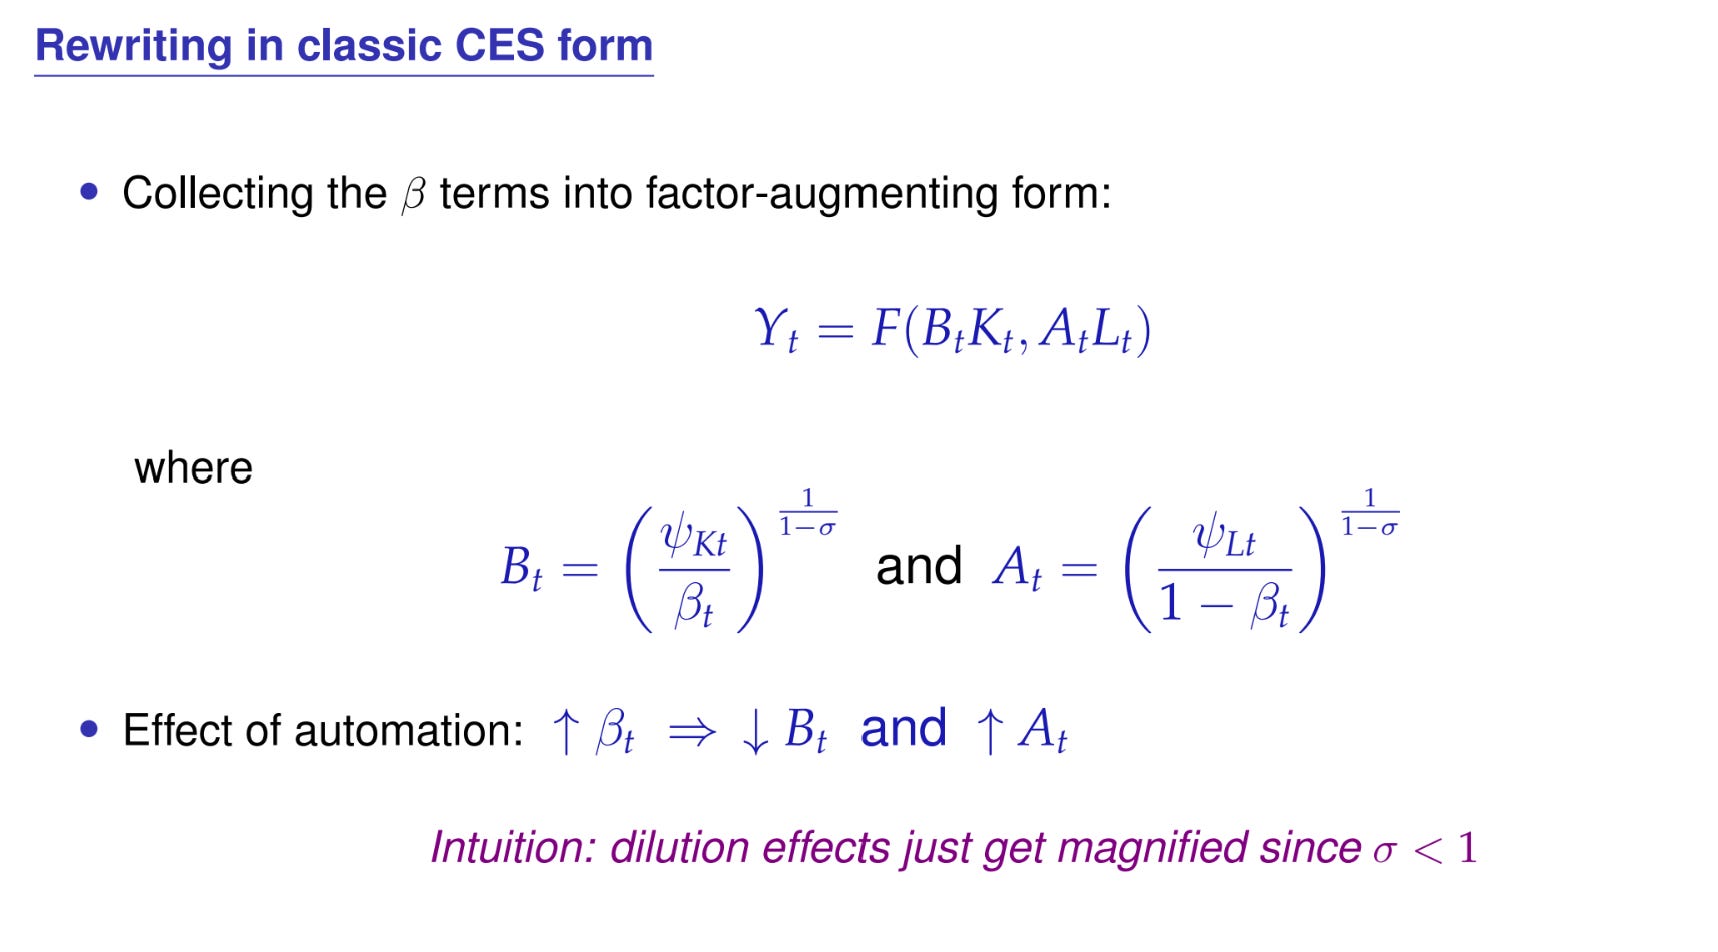
Output is a CES combination of BK and AL, where B = (ψ_K/β)^(1/(1−σ)) and A = (ψ_L/(1−β))^(1/(1−σ)). An increase in β causes B to go down and A to go up. You might have thought automation is capital-augmenting or labor-augmenting. It turns out it’s neither. Automation — an increase in β — is simultaneously capital-depleting and labor-augmenting. Capital is spread more thinly, so your weak links are weaker. Labor is concentrated, so your weak links are strengthened. That’s why B goes down and A goes up.
How does automation work?
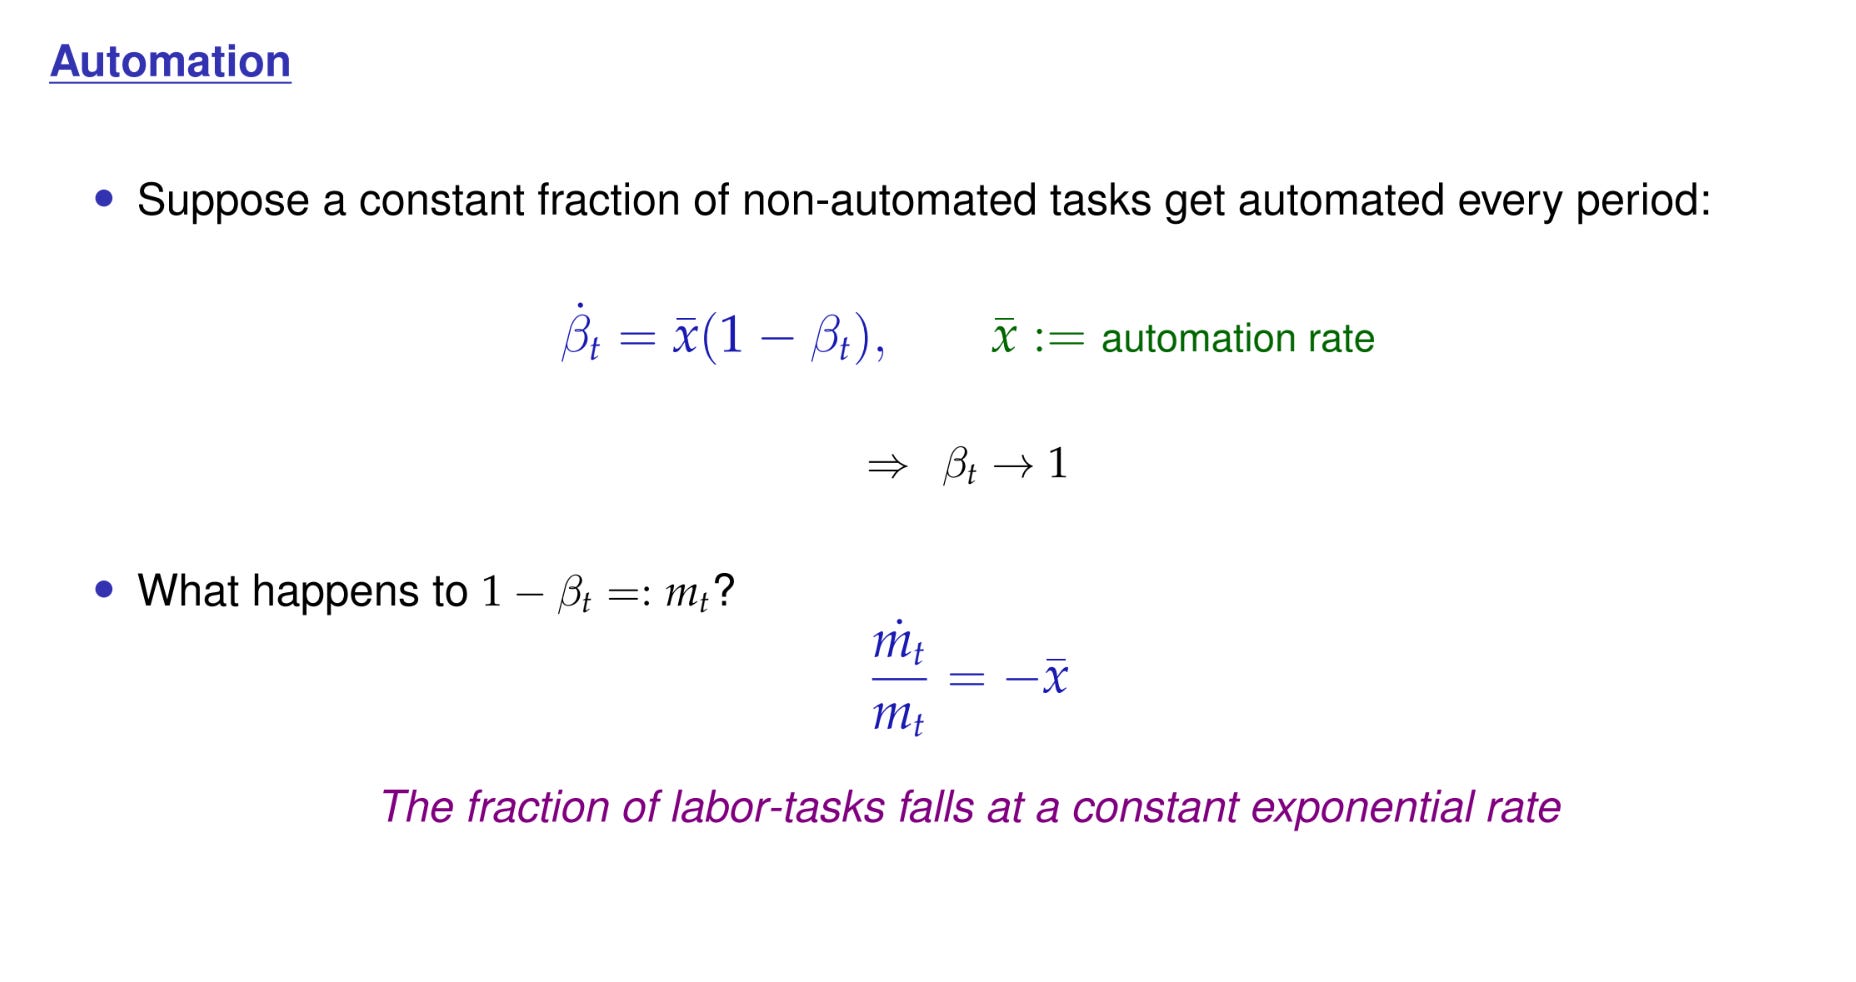
A simple way to think about it: you automate a constant fraction of the tasks you’ve not yet automated every period. 1−β is the set of tasks that haven’t been automated. Suppose you automate 2% of those every year, so β̇ = 2%(1−β). x̄ is the automation rate — what fraction of tasks you automate every period. If you look at this law of motion, it says β → 1. Eventually you automate an arbitrarily large fraction of the tasks. It only goes to 1 as t → ∞.
What happens to 1−β? It falls to zero, but at a constant exponential rate if the automation rate is constant. The growth rate of 1−β is -x̄. The set of tasks doing labor is falling exponentially at the automation rate.
Put these things together.
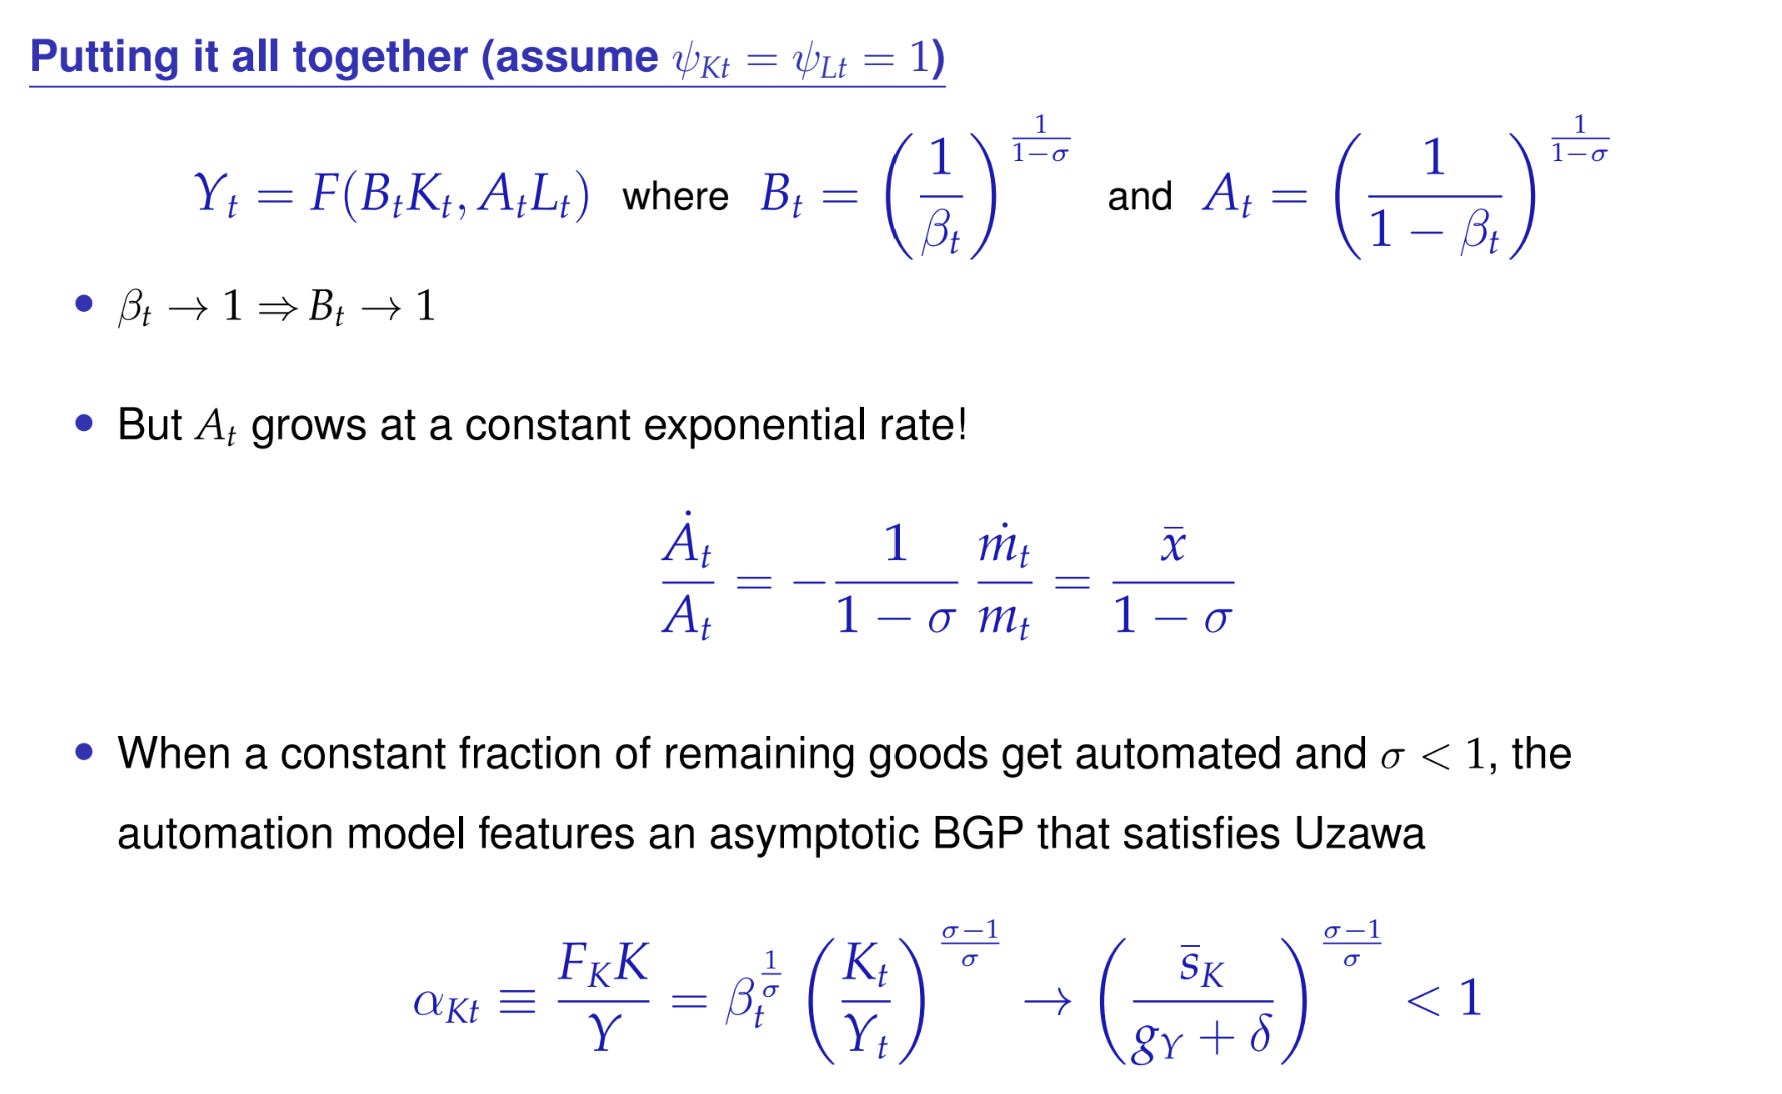
Let me turn off the ψ_K and ψ_L — pretend those are constant; I’ll relax that in a second. Then B = 1/β and A = 1/(1−β). B is going to be a constant eventually, and A is going to grow at a constant exponential rate, because 1−β is falling at a constant exponential rate, x̄, so 1/(1−β) rises at a constant exponential rate. The growth rate of A is constant.
This is a model where you’ve got As and Bs moving around, yet in the long run all technological change from automation is labor-augmenting. The B becomes a constant and you get Uzawa’s theorem satisfied. You can get a balanced growth path, and the capital share, importantly, is between 0 and 1. The capital share can be a third here, even though β → 1. This is the weak-link phenomenon: you’re automating all these tasks, but you’re constrained by the stuff you’re bad at. Labor is the stuff you’re bad at, so it gets a high return. With elasticity of substitution less than one, the scarce factor gets the share. Labor is always the scarce factor. Capital’s plentiful — you’re adding machines left and right, but you’re not adding labor, so labor keeps its share because it’s so scarce. This is a way of saying: don’t be so sure to assume that automation has to raise the capital share.
The Jones and Liu paper takes the framework I just laid out.
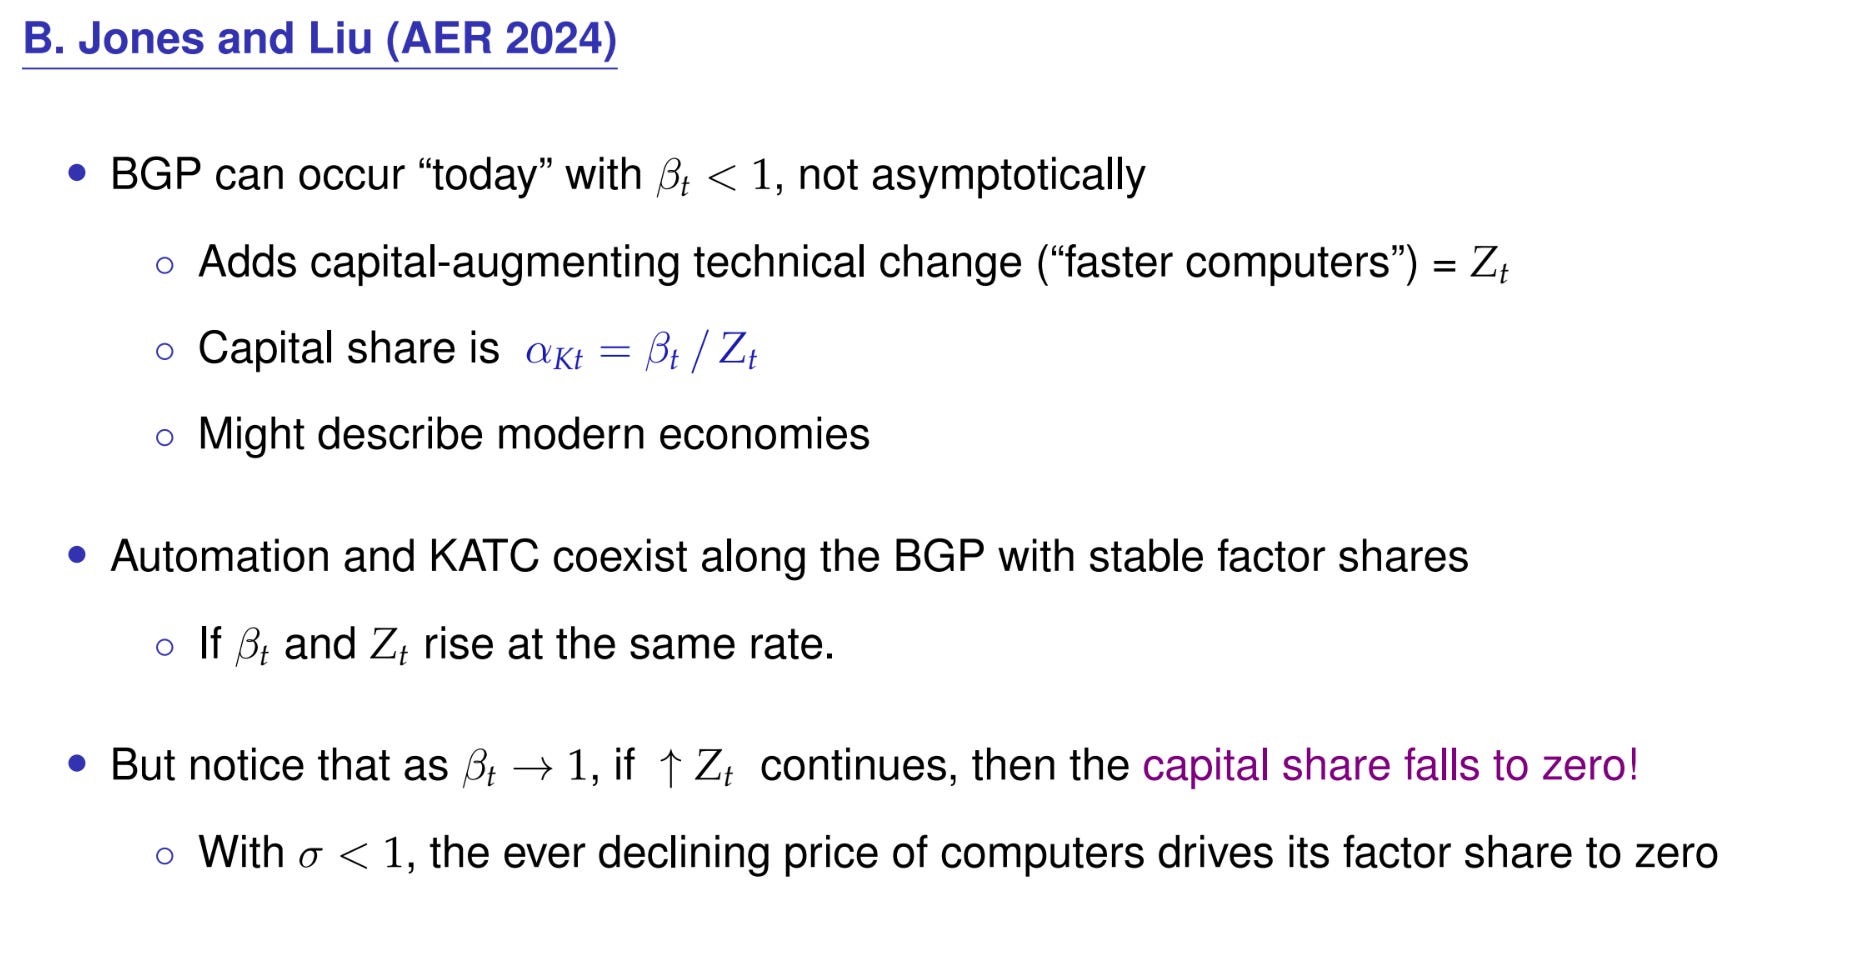
Aghion, Jones, and Jones didn’t have the ψ_K and the ψ_L; Ben [Jones] added the ψ_K, capital-augmenting technological change, which he called Z — faster computers. In that case the capital share is proportional to the ratio β/Z. Automation, increasing β, raises the capital share, but faster computers lower the capital share — again because of the weak-link phenomenon. You’ve got infinite machines, which means labor’s the scarce factor, so labor gets the share. Ben showed how you can have a balanced growth path that’s not asymptotic and a constant capital share.
An interesting thing about it: he had to rig it so that it worked, because β → 1. If Z kept growing — if our computers kept getting faster — and β → 1, then the capital share would go to zero. They had an interesting argument for why that might not be the case, but it’s an assumption. With σ < 1, the fact that computers are getting cheaper might drive its factor share to zero.
This led to an interesting question, this is in my new paper with Chris: what’s happened to the factor income share of computers? Just like the labor share, you could break it into skilled versus unskilled labor — what’s happened to the college-educated share versus the non-college share. Or you could break capital into the structures share versus the equipment share. You can look up, in the Bureau of Labor Statistics multifactor productivity tables, what’s happened to the factor income share paid to computers.
If computers are getting better, and getting better quickly, and σ < 1, it could go down. But it’s tricky, because computers are everywhere — you use them much more broadly, and that tends to raise the computer share. That’s the automation effect, the β. But there’s also the Z. It’s a race between these two things. Which way has it gone?
Here’s the data.
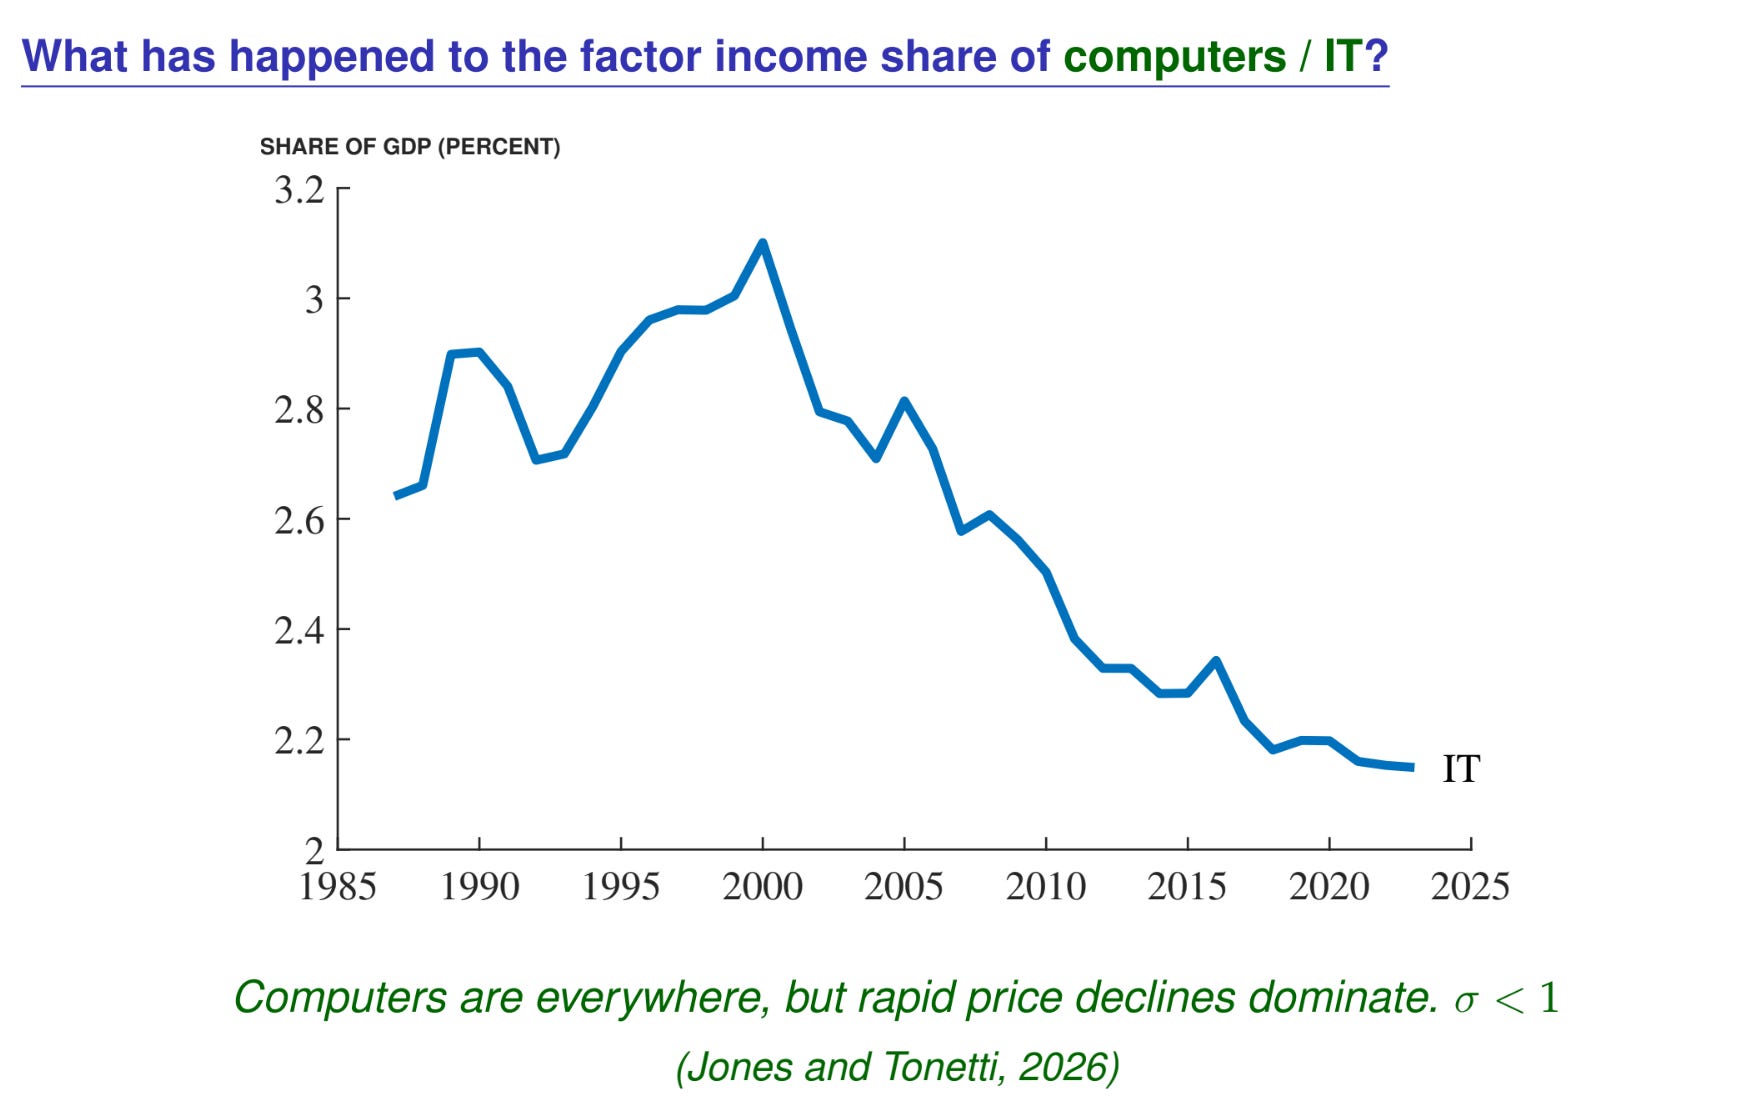
In the late ‘90s, the dot-com boom, the factor income share paid to computers went from 2.5 to over 3. But since 2000, over the last 25 years, the factor income share paid to computers has fallen by a third, from 3 to 2. Computers are everywhere, but the rapid price declines dominate. That looks a lot like evidence for σ < 1. If σ > 1, the computer factor income share would be going up, but because σ < 1, the price effect dominates. When we’re thinking about this AI future where computers are doing everything, it’s not obvious that the capital share goes to 1. It could, but be careful.
AI and Our Economic Future
There’s a good chance that AI is the most transformative technology in your and my lifetime. We’ve had lots of transformative technologies before — electricity, semiconductors, the internet — but I think AI could be more. The argument is: what if, in the next 50 years, machines — AI for cognitive work, and AI running robots for physical work — can perform every task a human can do, but more cheaply? What does it look like to live in that world? What does the transition path to that world look like?
Let me lay out two scenarios that are both extremes. First, AI dramatically accelerates growth. The other extreme: AI is just business as usual. The truth is somewhere in between, but it’s helpful to look at these two extremes.
The first scenario, where AI dramatically accelerates growth — this is what people in Silicon Valley talk about a lot.
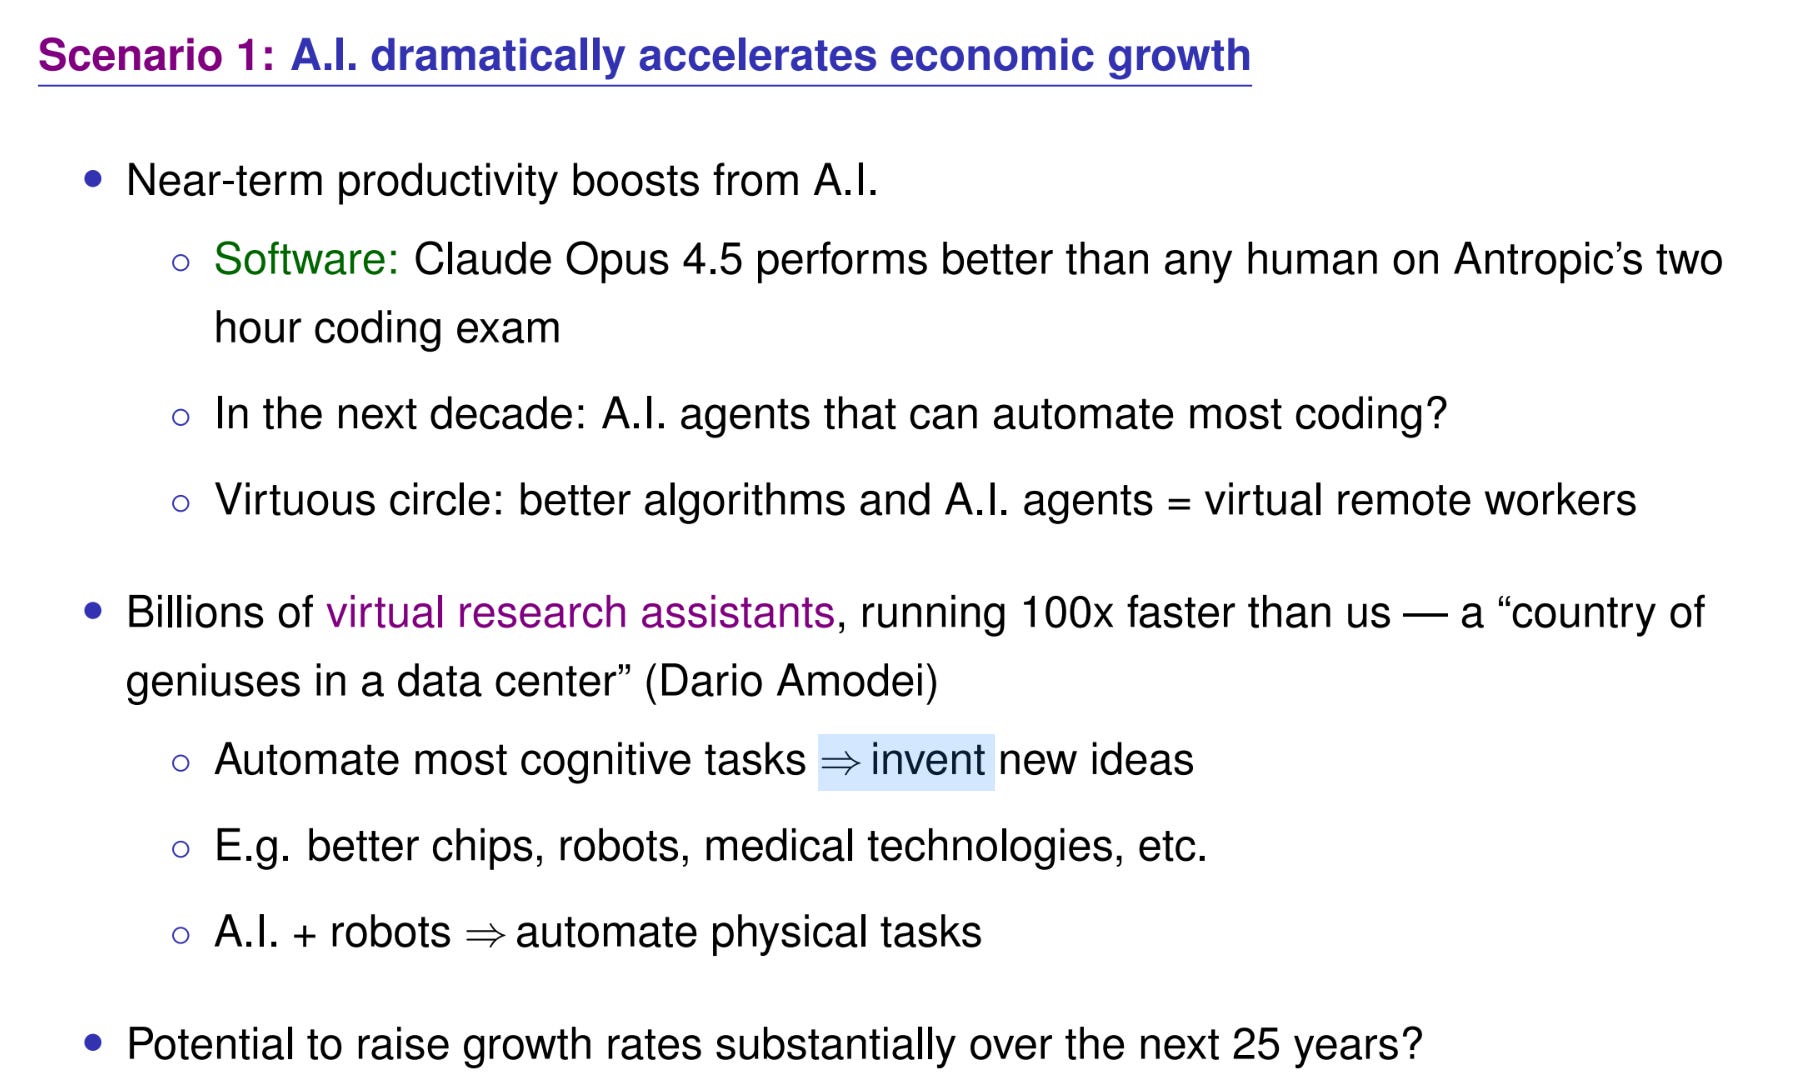
The first stage is AI automating software, and we’re already seeing evidence that AI is very impressive at that. The AI people for the last 10 years have been saying this is coming, and we’re right on path for what they were saying. They’re getting some credibility for these predictions coming true.
When Anthropic hires a software engineer, they give them a two-hour take-home exam, and it’s a hard exam. They gave the same exam to Claude Opus 4.5, the model before their latest one, and it performed better than any human in history. If you look at the horizon over which software models can perform tasks: two years ago it was four minutes, and now ChatGPT 5.3 Pro is up to six-plus hours — with 50% accuracy it can work for 6.5 hours to perform a task. Is it plausible that in the next decade, and maybe sooner, we’ll have AI agents that can automate most coding? Anthropic says that’s by the end of the year for them. It seems very plausible.
Once you have that, you ask your AI to do more experiments, design better algorithms, test them out, figure out what works, design better agents, get AI agents that can run a computer. Claude Code can basically run your computer now — not as effectively as it should, but it’s getting better at an astounding rate. Is it plausible that in the next decade your AI agent can do anything you can do on a computer? That’s not outside the realm of possibility.
Once we have that, we have these virtual remote workers. You can scale them up — they’re nonrival, infinitely usable. You run billions of these virtual research assistants, each running 100 times faster than us. This is what Dario Amodei called “a country of geniuses in a data center.” Once you have a country of geniuses in a data center, you ask them to:
Produce new ideas.
Invent better computer chips and robots. Build a virtual world to figure out the right way to build a robot.
Invent better medical technologies. Cure heart disease and cancer. AlphaFold on steroids.
Once you’ve designed better robots, we let the AI run the robots in the real world, and that automates physical tasks as well.
I don’t know that this has to happen, but in the next 25 or 50 years, if not sooner, each of these steps seems possible. For the last 10 years, people have been claiming we’d get to the end of the first set of bullet points, and we’re getting awfully close to that now, so maybe they’re right about the rest of the steps. If all this were to happen, it would raise growth rates substantially. I’ll show you some simulations in a second. That’s the dramatically accelerating growth scenario. I think this has a lot of merit. I might not 100% buy in, but is there some substantial probability of it? Yes.
What’s the other scenario? I’d also put substantial probability on business as usual.
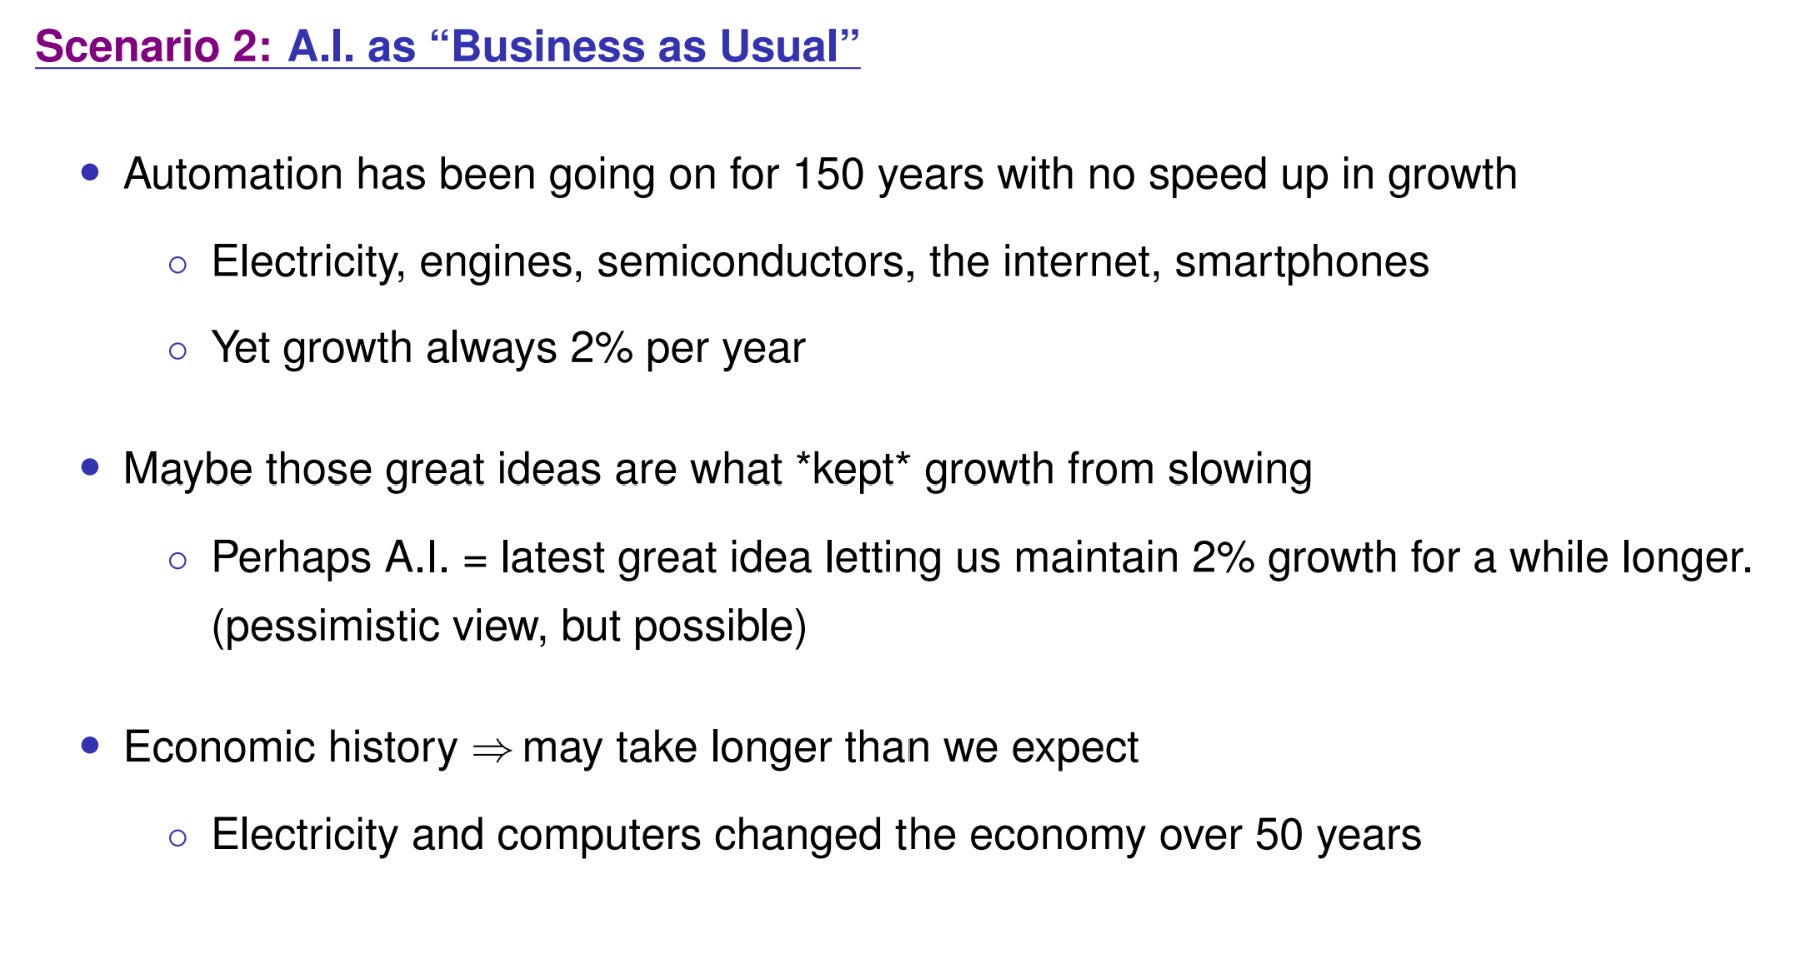
Automation has been going on for 150 years and growth hasn’t sped up. Remember the graph I showed you at the beginning.
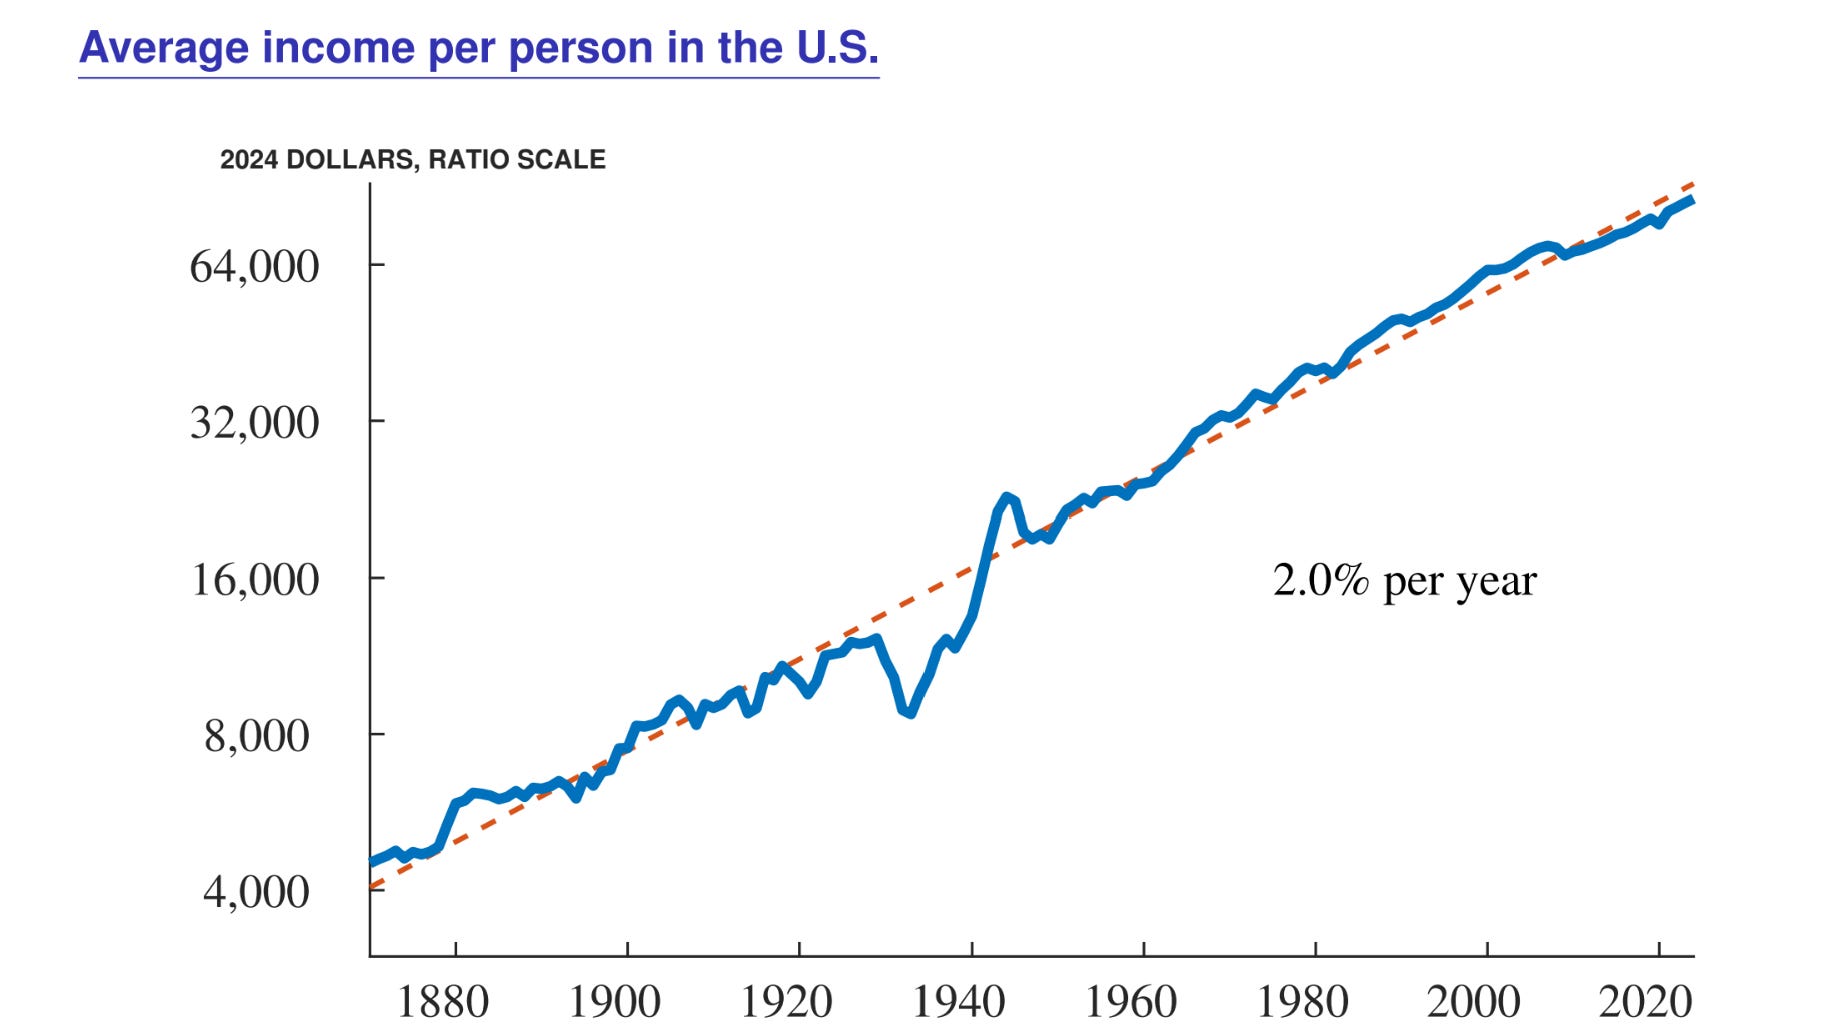
In 1870, electricity barely existed — we were just starting to apply it to lighting and then to factories. The electricity revolution was the first half of the 20th century. Then we invent:
Transistors,
Vacuum tubes,
Semiconductors,
Information technology,
Antibiotics,
The internal combustion engine;
all these monumental general-purpose technologies, and yet straight-line 2% growth.
What’s going on? What might be going on is ideas are getting harder to find. Within any technology class, there are sharply diminishing returns. It’s like a gold mine. The steam engine runs out of steam. If you don’t invent the next general-purpose technology — if you don’t discover the next gold mine — growth would slow down. We don’t see the counterfactual. The counterfactual is, if you don’t get anything after the steam engine, growth slows. But electricity let us have 2% growth for another 50 years. Each of those great ideas — we kept discovering new gold mines, and that’s what kept growth from slowing. Maybe AI is the latest gold mine, the latest great idea that gives us another 50 years of 2% growth.
That’s the most pessimistic view. I probably think it’s more than that, but that view has the advantage that we need to understand this graph. Automation’s been going on and growth hasn’t sped up, so you need to fit those facts.
The second lesson from economic history: you all know Paul David’s article about the steam engine and electricity — the dynamo, the gradual adoption. Or Erik Brynjolfsson’s work on information technology. Solow: we see computers everywhere but in the productivity statistics. All these things do transform the economy, but that transformation requires complementary innovations, diffusion, applications, and organizational changes. The transformation happens over 50 years rather than overnight. There’s a good bet AI is going to have that same feature — that it takes longer than some of the more optimistic people think.
Let me show you some simulations.
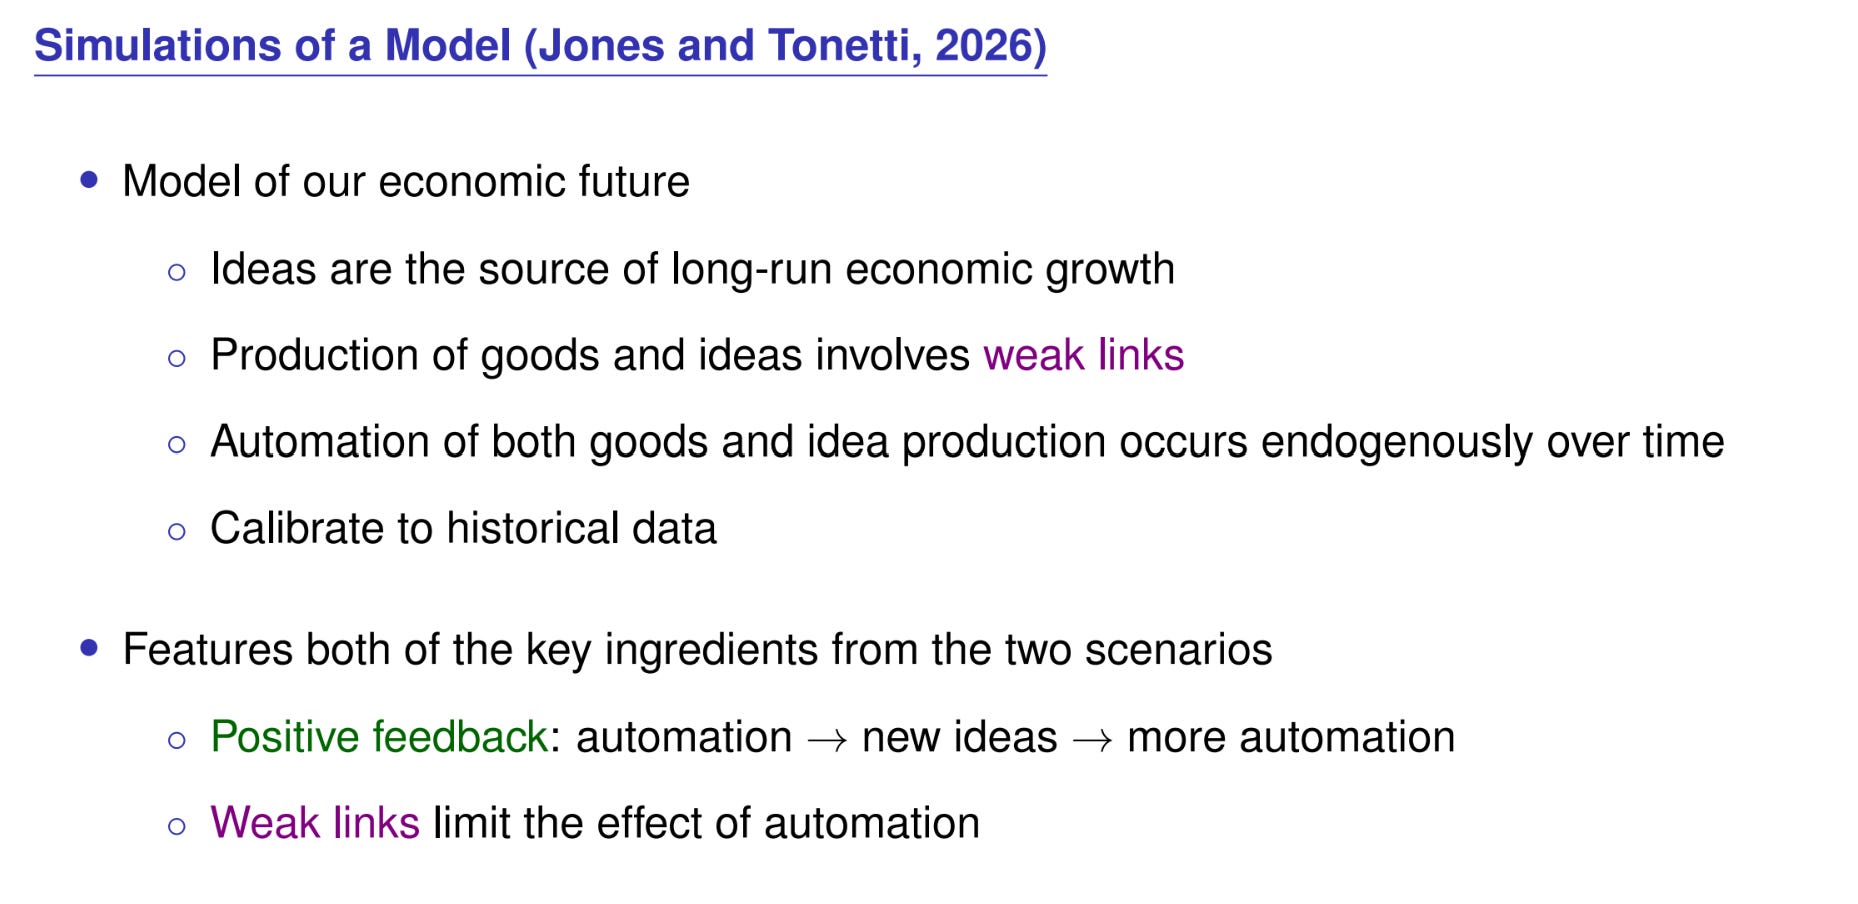
Chris Tonetti and I have a new paper, where we take the Aghion, Jones, and Jones view of the world, take the data very seriously, and use historical evidence to calibrate a growth model and run it forward. The key finding from the historical evidence is, what is automation? Automation is replacing slowly improving humans with rapidly improving machines on an ever-expanding set of tasks. We estimate machines are getting better about 5% per year faster than humans are getting better, at least. Substituting more tasks to rapidly improving machines is the quantitative source of growth in automation.
Then we build a model and calibrate it to the evidence from the first half of the paper. It’s an idea-based growth model: you invent new ideas and that helps you automate. When you automate that helps you invent new ideas. Both the goods production function and the idea production function get automated endogenously. The model has these two key ingredients from the two scenarios. On the one hand, there’s the positive feedback loop — automation gives you new ideas, which gives you more automation, which gives you more ideas. There’s a flywheel effect. But there are also weak links, which limit the effect of automation. Imagine you’ve got a chain with 20 links, and I make 10 of the links infinitely strong. That’s good, but your chain is still limited by the weak links. Those weak-link effects can be very important.
We simulate the future with three scenarios.
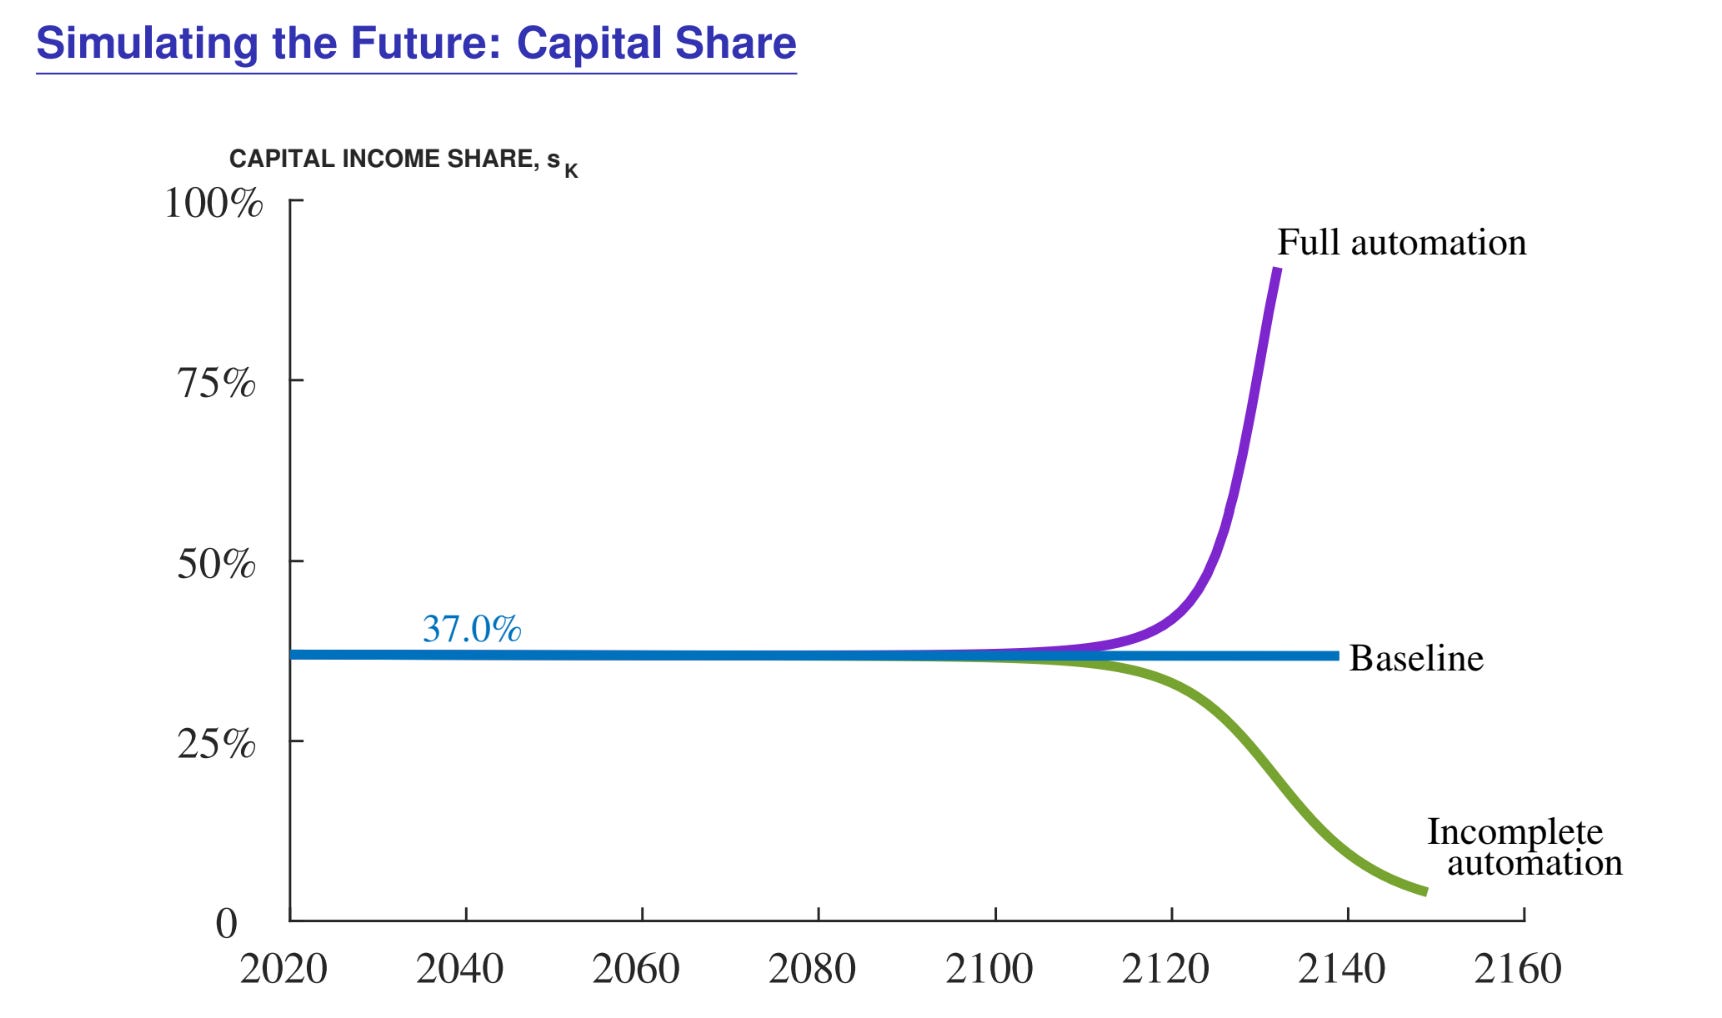
In one, all tasks can be done by humans in finite time — there’s no task a machine can’t do someday. If it’s full automation, you eventually get an AK model where the A is growing because machines keep getting better, so the capital share goes to 100%.
There’s an incomplete automation scenario where we say 3% of tasks can never be done by machines. Then 97% of tasks, you get infinitely strong because your machines keep getting better, but it’s a weak-link model — you’re constrained by those 3% of tasks and the rate at which humans get better. The labor share goes to 100% and the capital share goes to zero, just like the computer graph.
Then there’s a case in between where the capital share remains constant.
What do we find?
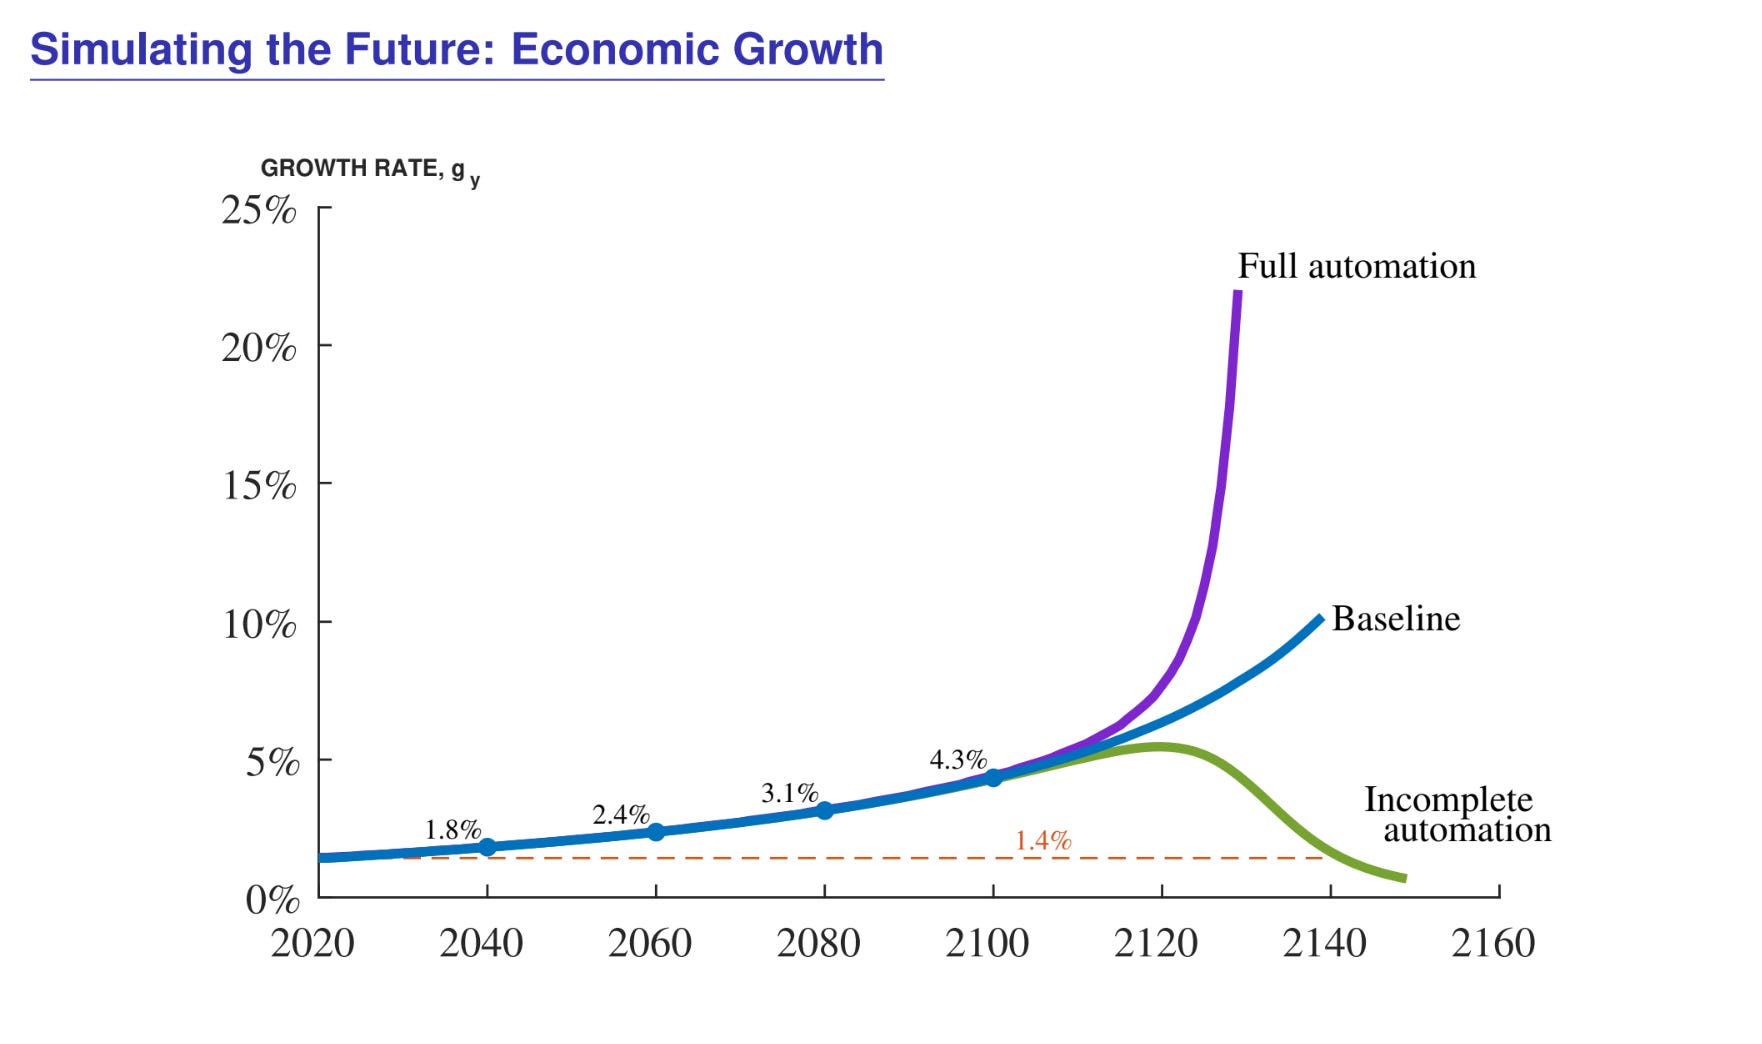
Running the model forward starting in 2020:
In the full automation case growth explodes.
In the incomplete automation case, in the long run the growth rate is the rate at which humans get better, which we estimate to be very slow, 0.5% per year.
Interestingly, in the baseline case, where the capital share remains constant, growth also explodes. That surprised me. You’ve got this weak-link model, capital share constant — I thought maybe growth is constant, but no. You’ve got the flywheel effect automating stuff, and the weak-link effect, but eventually you automate all the weak links, because the baseline case says you can automate everything eventually, though it takes infinite time. That’s enough to give you explosive growth.
Let me show you the levels.
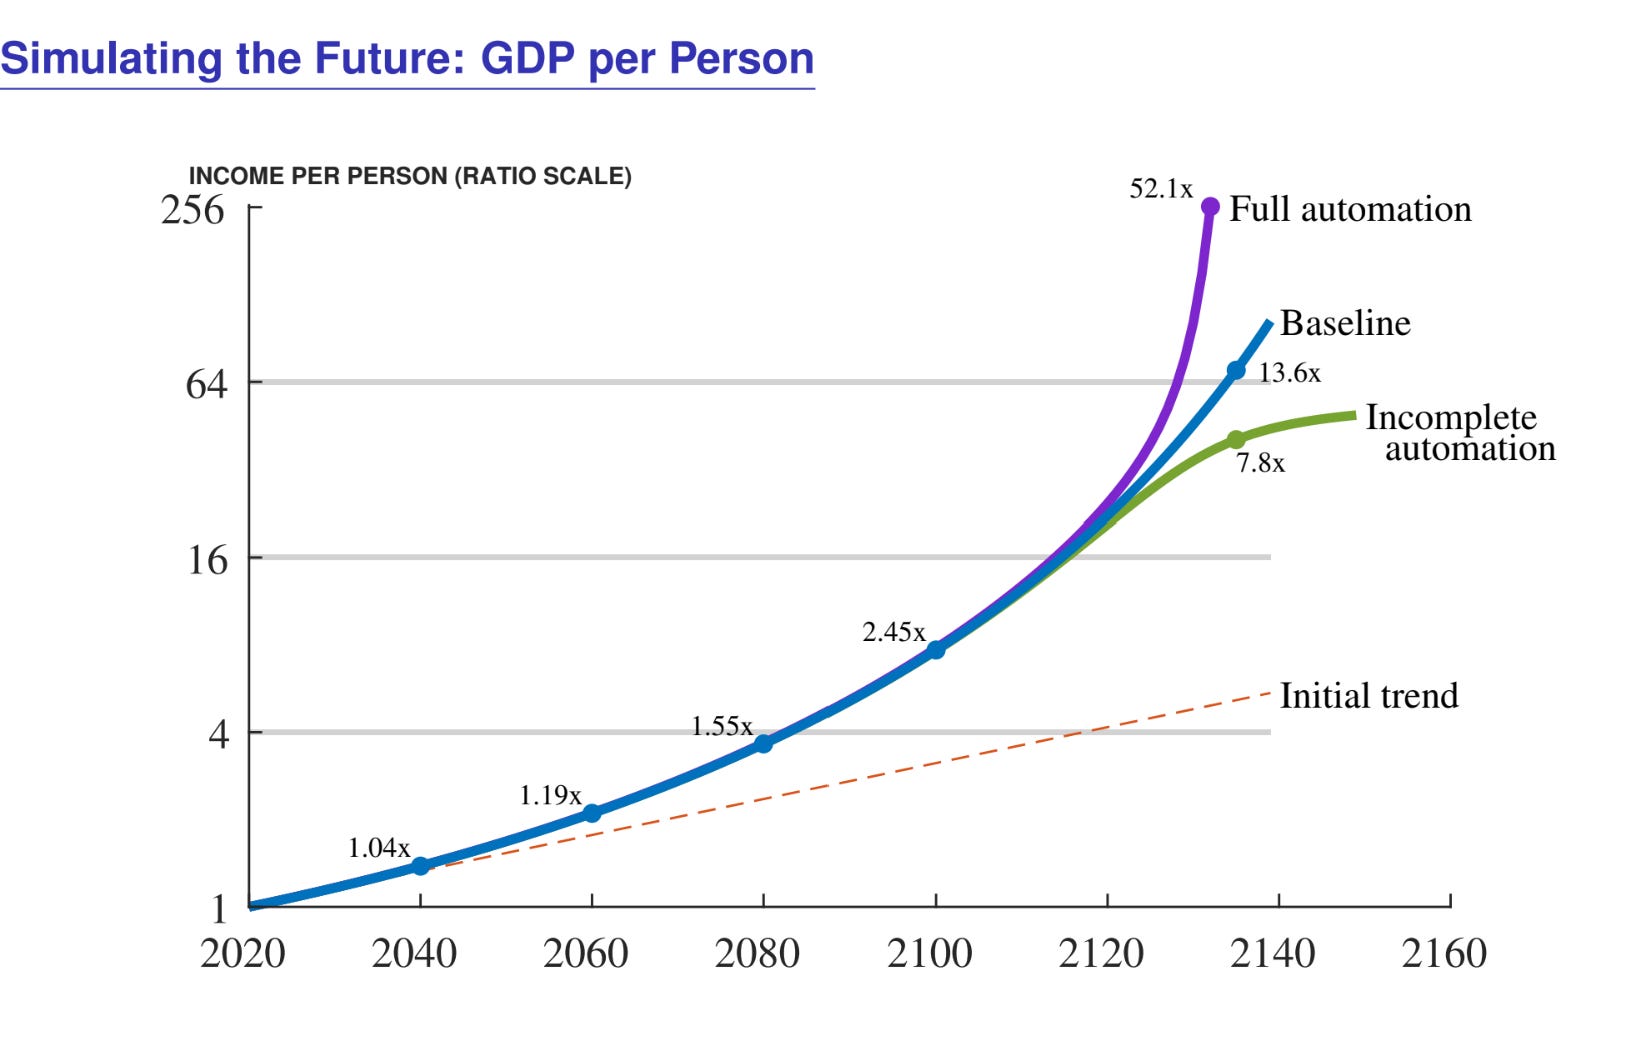
You can see growth exploding in the purple line. The interesting thing about the levels is that even though growth rates for the next 75 years are rising up to 5% per year, all three cases that look very different in the long run look very similar for the next 75 years. And, for the next 75 years, it’s remarkably small. Relative to the constant growth trend, we’re only 4% richer 20 years from now, and even 40 years from now we’re only 19% richer.
Growth accelerates, but it accelerates incredibly slowly. Growth explodes, but the explosion is slow. This is exactly the weak links: you get really good at some things, but you’re always constrained by your weak links, and that slows down the explosion. The explosion’s coming — you see it in all three cases. In the long run, in the incomplete case, it goes back, but growth accelerates incredibly slowly. In the next 50 years, we’re not learning too much about which of these three cases we’re in.
Growth explodes, but surprisingly slowly. We may have more time than I thought to handle the problems. I meant to have time to talk about the problems — jobs, what we’re going to do, inequality and meaningful work, and existential risk.
Existential risk
I’ve written two papers on existential risk, and I think these are problems we really do want to take seriously. Let me do one slide on existential risk, because people don’t talk about this enough.
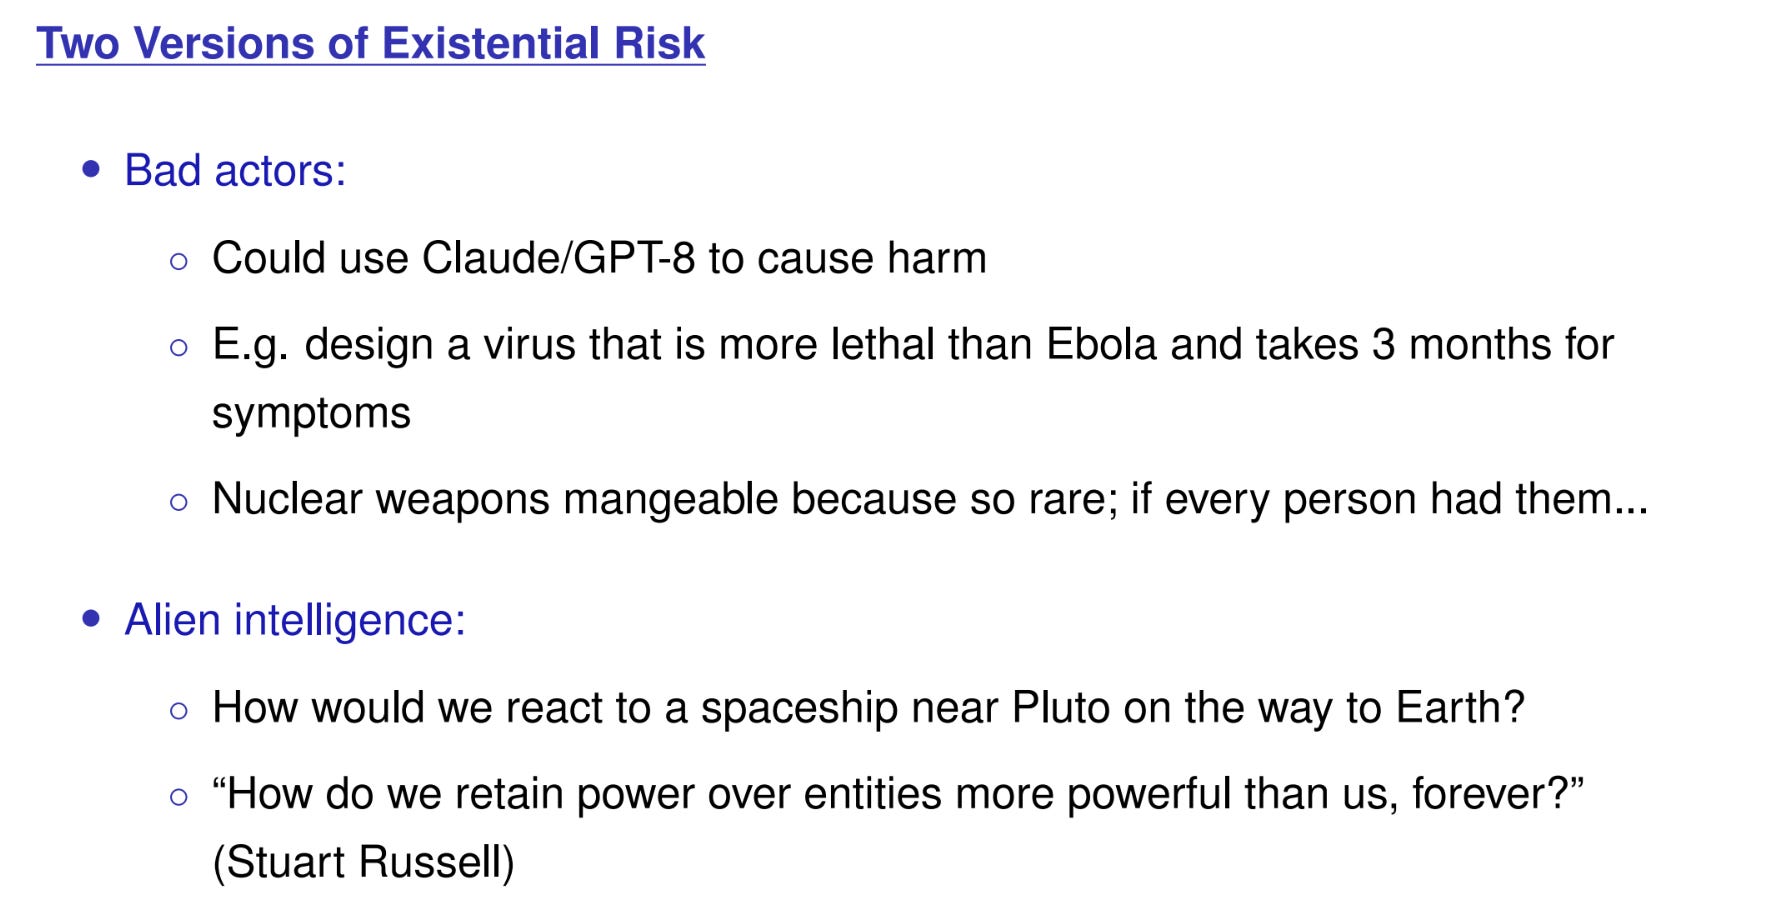
There are two versions. The first, the bad-actor model, I think people are amenable to. Imagine ChatGPT 10, improving exponentially, incredibly good — this oracle that can answer any question. If we haven’t figured out how to keep it from answering any question, then a bad actor could ask it to design a virus more lethal than Ebola, that takes three months to display symptoms, and kills an enormous number of people. Nuclear weapons were manageable because they were rare — only two people had the red button, and we’ve managed so far not to press it. If eight billion people had access to a red button, can you make sure no one presses it? That seems like a problem. That case is easy to say yes, we should worry about.
The alien intelligence case is a bit more science fiction, but totally something we should worry about. Suppose we found out this afternoon there’s a spaceship on its way to Earth, passing Pluto. How would we feel? We’d be excited. We’d learn a lot. Yet on Earth, when advanced people or species encounter less advanced, it often doesn’t end well for the less advanced. Think about the Old World and New World, or horses and people. Maybe this would be dangerous as well. How sure are you this alien intelligence is going to be fine? We’re growing alien intelligence in these AI models right now, and we don’t understand them. Stuart Russell, a CS professor at Berkeley and co-author of one of the top machine learning textbooks for graduate students — I was on a panel with him and he asked this question: “How do we retain power over entities more powerful than us, forever?” That last word is the kicker.
To conclude.
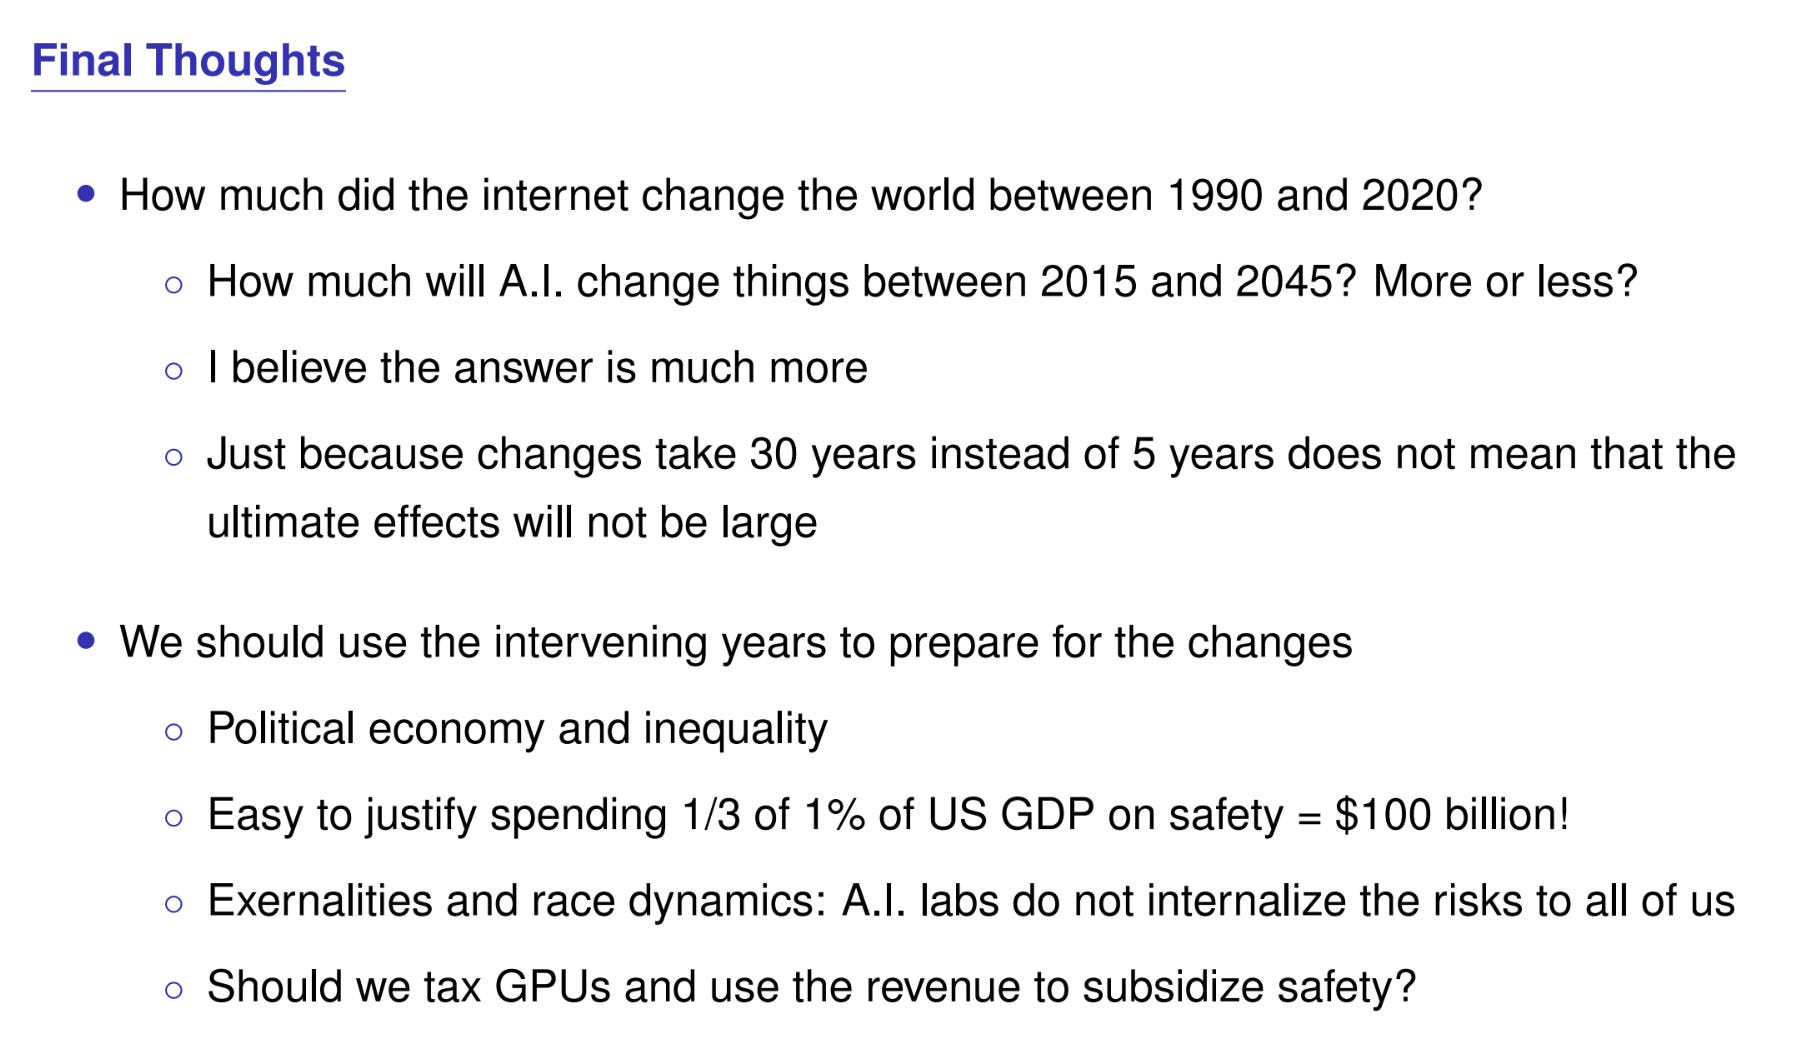
I like to think of AI in terms of the internet. How much did the internet change the world in the 30 years from 1990 to 2020? It’s hard to see in the statistics — again, straight line — but the answer is a lot. You don’t know the counterfactual. How much will AI change things between 2015 and 2045, more or less? How many internets — two, five, ten? I think the answer is a lot. Just because the changes take 30 or 50 years instead of five years doesn’t mean the changes won’t be profound. Because of the weak links we have more time than I had thought. But we should absolutely use those intervening years to prepare for the changes that are coming. The political economy, the inequality, the jobs, and the catastrophic risk are all things we should be worried about.
How do you make sure you get your share of the pie? Historically, labor is the main asset many people have, that they trade for consumption. In a world where AI automates many tasks and therefore many jobs, and can do everything a human can do, whether cognitive or physical — maybe your labor asset isn’t worth very much, because it falls to the price of the machine. Maybe the pie is huge — how do you make sure you get your share? Something like give every newborn child a share of the S&P 500. That should work, but let’s acknowledge there’s a big political economy problem there. We need to think hard about that, and the transition could be very hard.
The costs are very important to consider. A sad thing is that in the world we live in right now, AI is exploding, and the thinking about catastrophic risk, or labor market effects, or how we redistribute, is behind the ball. We definitely need more good thinking there.
All these slides and papers are on my web page if you’re interested in seeing more.